 Invenia Blog
An Introduction to a Most Sagacious Sumo
15 Sep 2018For a logging and monitoring system to provide the most amount of value, its front end must be easily accessible and understandable to the developers and administrators who may only have cause to interact with it once in a blue moon. We have recently adopted Sumo Logic alongside our existing tools with the intention of replacing them. Sumo Logic is a web service that serves as a central collection point for all your logs and metrics, and aims to provide a friendly but easy-to-use interface into the formidable quantities of data generated by your systems. With Sumo Logic, you can monitor your logs and metrics using scheduled searches to alert your teams to important events. This post will provide a short, high-level introduction to some of Sumo Logic’s features, with a few thoughts on how it performs and what we hope Sumo Logic can do for us in the future.
Because Sumo Logic is meant to graphically display your logs and metrics, most interactions are done through the web interface. It is from here that queries are written, dashboards viewed and data ingestion configured. Sumo Logic ingests data using “collectors” which come in two types: installed and hosted. Installed collectors are java programs that are installed on your servers to collect logs and metrics from local sources, although they can also do things like run a syslog server or access files over SSH. Hosted collectors are a mixed bag; they can provide you with a URL so that you can send data directly from your sources, or they can integrate directly with other services to collect data from Google Cloud or Amazon Web Services.
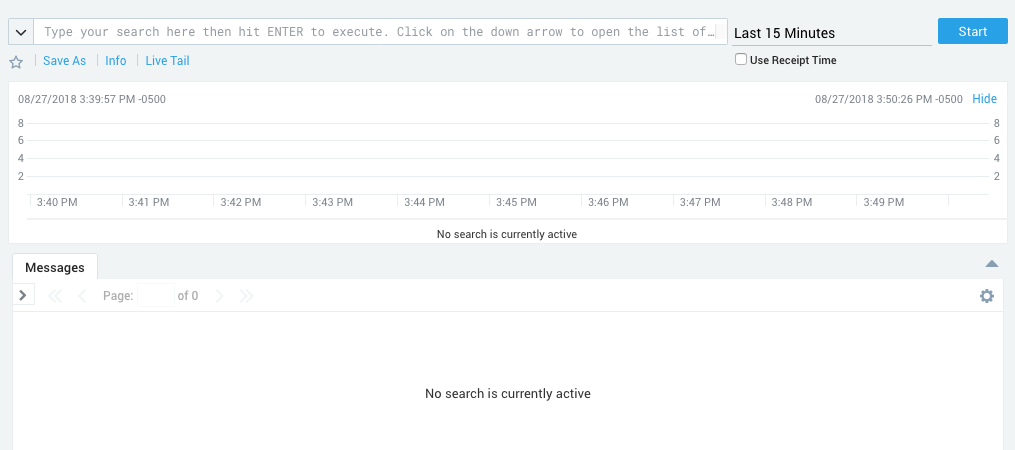
So that you may view your logs, Sumo Logic provides an interface containing a bar graph that breaks down the times when you received the most number of messages, a text field to enter a search, and a stream displaying all the matching logs. The most basic searches match a string against the body of the logs, but further refinement is easy. Sumo Logic keeps some metadata about your log sources by default, and keywords can be used in searches to help filter logs based on this data. These default categories are mostly intrinsic to the collector or are specific to the machine the collector is on (such as the id of the collector, the collector type, the hostname, etc.) but there is also a custom “source category” that can be entered by whoever set up the collectors to help group logs by function. Using categories to refine searches is simple and easy because the interface provides a tool-tip that suggests available categories, and this tool-tip can be expanded to list all available categories and all possible values.
Sumo Logic provides operators that allow you to perform parsing at search time so that you may create new columns in the log stream that contain the fields you are most interested in. These custom fields may also be used to further refine your search, allowing you to make effective use of identifying information within the logs themselves. Other than the parsing operators, Sumo Logic provides many other operations that can be performed during a search. Many operations are dedicated to working with strings, while others cast parsed fields into numbers and allow their manipulation. Additional operators allow you to group fields and change the output of the search, allowing you to focus on fields important to readers and hide additional fields used in the search. There are also miscellaneous operators such as count, which returns the number of results, or geo lookup which returns geographic coordinates based on an extracted IP address.
Individual log searches can be saved to a library for personal review or shared with others. These saved searches can be can be run manually or scheduled to run at intervals (you can even write a crontab expression if the fancy takes you and you’ve had your coffee) with the results of the search being emailed or sent through a web-hook. Combining this with thresholds (there are more/less than X results or some other condition), you can monitor your infrastructure and automatically alert someone when something goes awry.
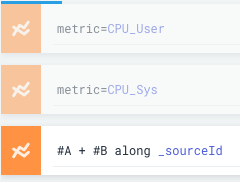
Viewing metrics is just as easy as viewing logs. The metric search interface contains a graph for displaying results, text field for entering the query, a tab for setting the axes, and a tab for filtering the results. The language for creating metric queries is the same as for writing log queries and differs only in the operators available. A successful query will return one or more time series, and most of the operators are dedicated to combining and transforming them by group (finding the min value or summing by hostname). Another difference from log searches is that once you have entered a query, a new query box will appear allowing you to run another query and add those time series to the graph as well. Queries can be referenced in future queries as well and you may perform mathematical operations to create new time series that are combinations of old ones. For example, this allows you to create a graph displaying total CPU usage by writing three queries: a system CPU usage query; a user CPU usage query; and a third query, which adds the previous two results together along hostnames.
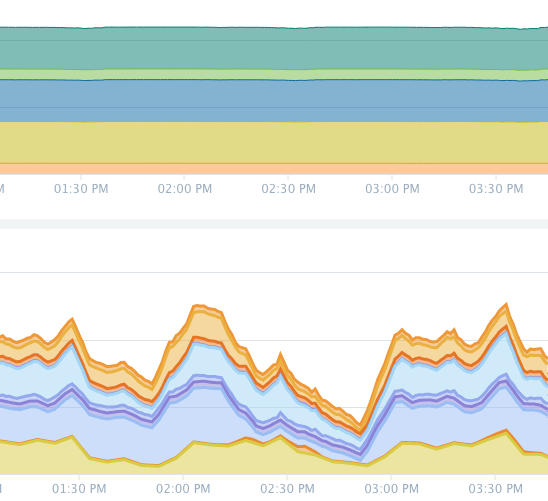
The metric search interface also includes a box for entering a log search. When combined with a log search, a bar graph will appear above the time series results to help correlate between trends in the time series and spikes in the number of matching logs.
Metric searches are saved and scheduled a little differently than log searches. Rather than being saved in the library, there is a metric alert screen that lists all previously created alerts, and it is from there that new metric searches can be created and saved (although a search created in the metric search interface can be automatically filled out in the metric alert interface). Metric alerts are a little more powerful than scheduled log searches because they can have multiple connections enabled at a time for their results (email, webhook, etc.), and have both critical and warning conditions.
Besides saving individual log searches for review later, searches of both types can be saved to panels in dashboards so that less experienced users can get a quick view of what’s going on across your systems without having to write their own searches. Dashboards normally operate in a mode where they must be refreshed manually to view new results, but they can also be operated in live mode where the panels are refreshed as results come in.
Currently, we use Sumo Logic to collect data originating from our applications and infrastructure. This data mostly takes the form of syslog logs, and metrics collected through installed Sumo Logic collectors.
The syslog data is collected in a central place in our infrastructure by a Sumo Logic collector running a syslog server. This is a hold-over from our old system and comes with a slight disadvantage; searching logs is slightly more complicated because as far as Sumo Logic is concerned, the logs come from only one source. This means that messages must contain identifying information, and searches must be written to parse this information. This is not much of an issue in practice because parsing is likely something a log search would contain anyway, but it adds an extra step to learn and increases the complexity of writing a search for a beginner. We have a battery of scheduled searches monitoring the data from our applications which alert based on the source and syslog severity level of the message as well as the presence of some keywords within the message body.
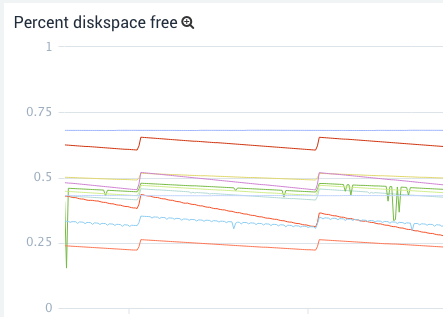
Metrics on the other hand, are ingested by collectors installed on each machine. This means that the metrics can be divided into appropriate categories and Sumo Logic collects metadata from every machine that makes searching easier. The installed collectors can be managed from Sumo Logic’s web interface, making it easy to change which metrics are collected and what category the collectors are in on a per-collector level. The rate at which metrics are collected is also controlled from the web interface, allowing you to control volumes if you are encroaching on your account limits. We had initially tried a solution where all metrics were being funnelled to a single collector running a graphite server but we found the convenience of managing each metric source from the web interface to be very helpful, (more so than for logs) and writing metric searches for this single collector was difficult. Most of our metric alerts monitor the free disk space on our servers and each alert is responsible for monitoring a specific class of device. For example, most of our boot devices have similar sizes and behave similarly so they can all be handled by one alert, while some devices are used for unique services and require their own alerts.
The data we currently collect isn’t of interest on a day-to-day level so currently Sumo Logic’s only role is to monitor and create PagerDuty alerts and Slack messages using web-hooks when something goes wrong. Compared to our old setup, Sumo Logic provides greater flexibility because it is much easier for a user to write their own search to quickly get a time series or log stream of interest, and our dependency on prebaked graphs and streams is diminished. Sumo Logic Dashboards also hold up to our old dashboards and have the advantage of combining graphed metrics with log streams and allowing users to extract a search from a panel so that they can tinker safely in a sandbox.
Our next step is to make better use of Sumo Logic’s analytic resources so that we might provide insight into areas of active research and development. This will require working with teams to identify new sources of data and come up with useful visualizations to help them make decisions relating to the performance of their systems. In expanding the amount of data we are collecting, it might be useful to reduce search time by splitting data up into distinct chunks using Sumo Logic’s partitioning features. Sumo Logic has also announced a logs-to-metrics feature which, when released, could be very valuable to us, as our logs contain numeric data that would be interesting to chart and monitor as if they were metrics.
Sumo Logic may initially appear complicated, but its interface is easy to use and can walk you through writing a query. Sumo Logic is a combined central collection point for logs and metrics, and offers flexibility and greater visibility into our data. If you are interested in using Sumo Logic or would like to know more details about all of its features checkout their website or the docs.