 Invenia Blog
National lockdown effects on European electricity consumption and system planning
31 Mar 2020In the midst of the ongoing global coronavirus crisis, management and accurate planning of electricity grids is all the more important, in order to reduce the risk of blackouts and ensure power can be supplied to crucial industries. With an ever-growing estimate of 1.7 billion people under some form of lockdown as of March 24th, the usual daily patterns of electricity usage across the world have been changing dramatically. Already, we have seen reports showing that electricity demand across Europe has drastically decreased since it became the epicentre of the pandemic. One might think that excess supply of electricity can’t be a bad thing, however, electrical grid management is a careful balancing process where energy supply must equal demand at all times. Oversupply of electricity can cause transmission line overloading, and if managed incorrectly this may have drastic consequences.
We had a look at some data from European and American electricity grid operators, and in a series of posts we will try to answer the following questions:
1) Have there been any interesting changes in daily patterns of energy usage, other than notable decline?
2) Could forecasting of daily electricity demand be more difficult now that so many people are working from home?
3) With reduced generation required to meet demand, how are the energy source mix and pollutant emissions affected?
To what extent are lockdown restrictions affecting the amount of electricity we use?
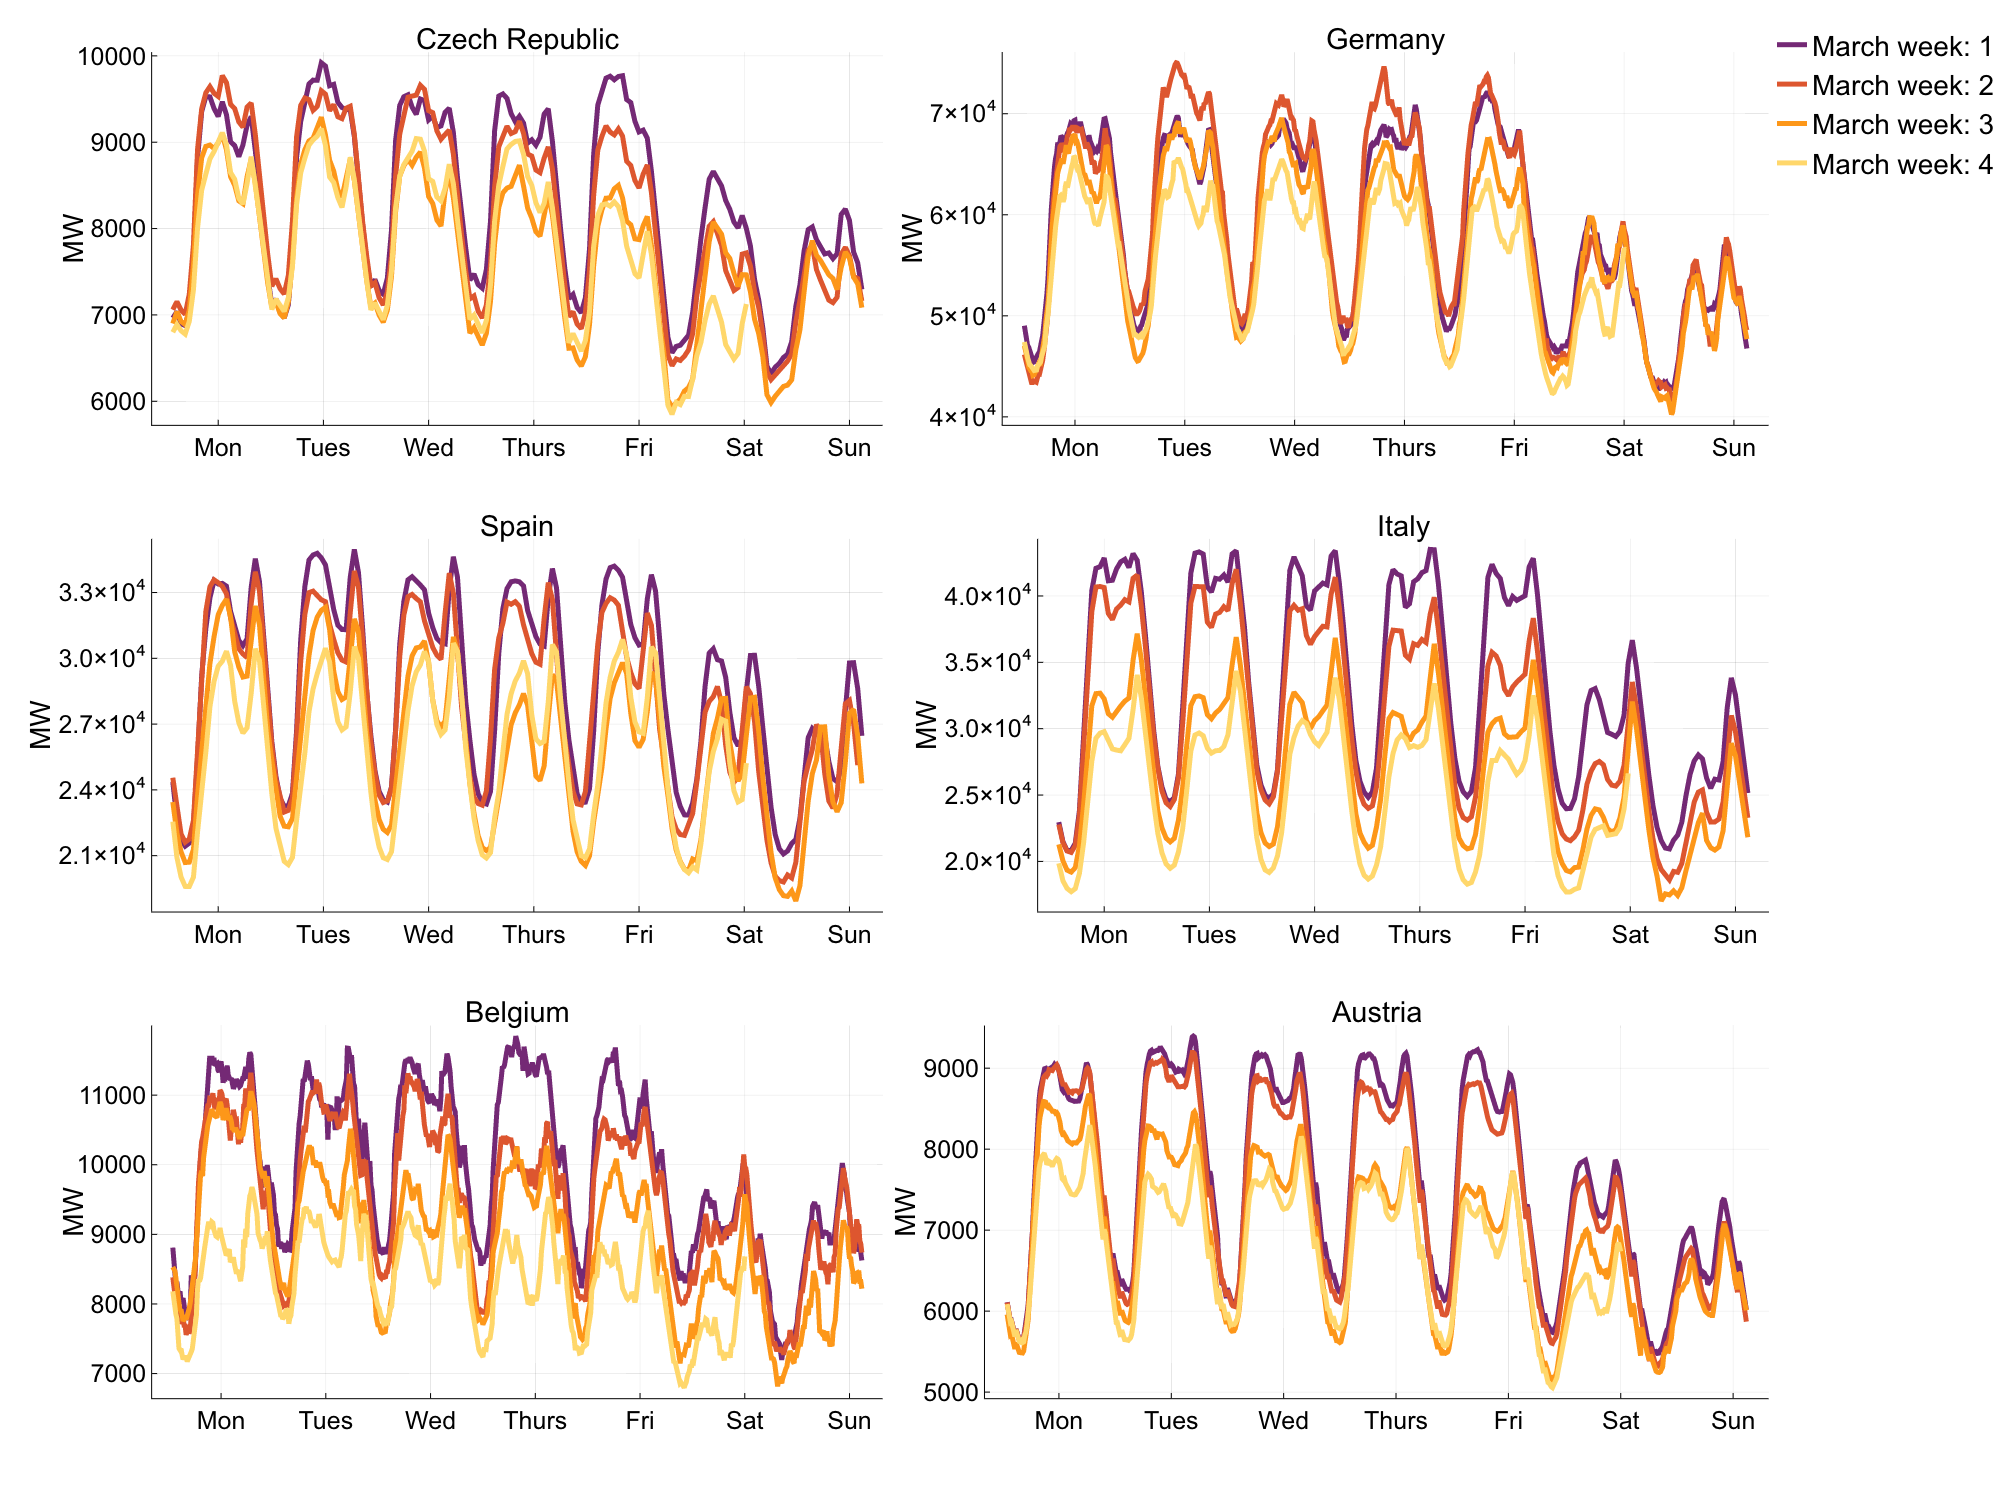 Figure 1: Week on Week electricity demand in March 2020 1.
As we can see from the plots in Figure 1, demand for electricity across many European countries has experienced a drastic decrease, week after week, throughout the whole of March. People who normally commute to and from work are instead staying home, so we might expect the weekday demand would look similar to the weekend demand, as office buildings, schools, and universities are closed. Looking at Figure 1, it is clear that as the lockdown measures continue, we begin to see these large reductions in peak weekday demand. This decline is particularly apparent in Italy, where strict lockdown measures have been in place for several weeks. By the 4th week of March, the peak weekday demand in Italy has fallen below the peak weekend demand seen in the first week of March. It’s likely the usual peak weekend demand is greater than current weekday demand due to the closure of many businesses, such as restaurants, bars, and galleries, which often see the most activity during weekends.
To clarify, our plots have not been adjusted for temperature changes in March. It’s important to note that whilst electricity demand is weather dependent, it’s clear that the changes we see in demand are not solely due to gradual temperature increase throughout March. A high estimate of the effect of temperature would be 1.5-2% demand change per 1°C. In many countries, we observe ~20% demand decrease which would correspond to a 10°C change in temperature. The large declines in demand that we observe are more consistent with school/business closures during holiday periods, as we would expect given the current restrictions in place in many European countries.
How might we expect national lockdowns to affect daily demand profiles?
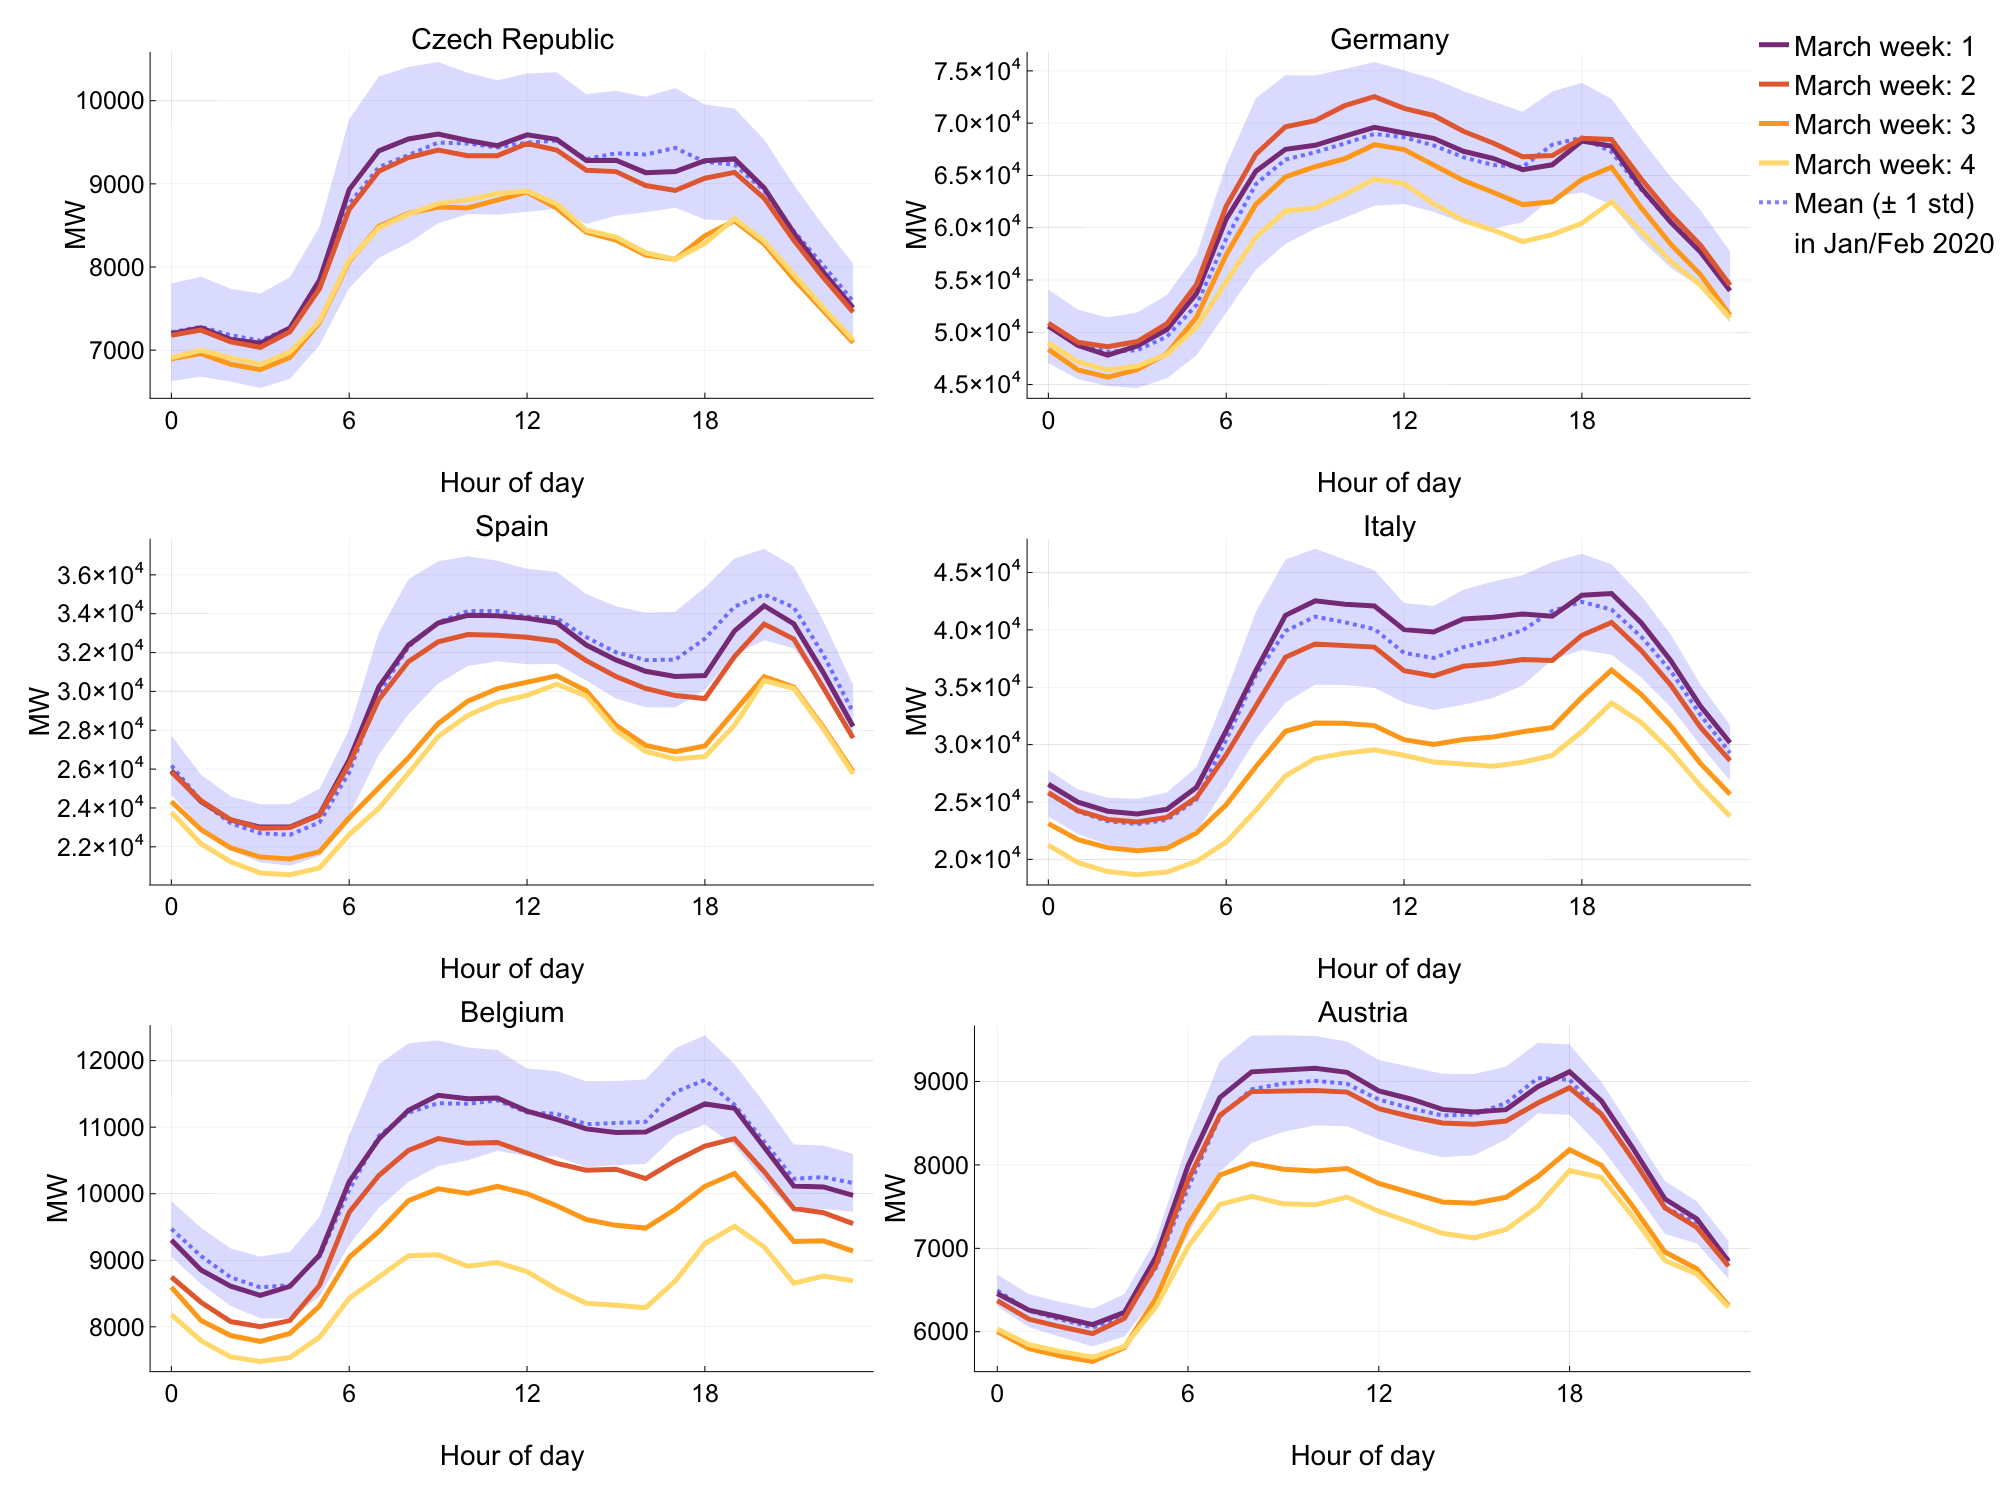 Figure 2: Hourly electricity demand profile, averaged over weekdays for each week in March (coloured), and all weeks leading up to March (black/blue).
Looking at the hourly electricity demand, averaged over weekdays for each week in March, and comparing to the hourly demand averaged for all weeks in 2020 leading up to March, we see several notable differences (see Figure 2). Other than the prominent decline in peak demand as the weeks progress, the morning peak in Spain and the Czech Republic has been shifted later by several hours. It’s possible that people are starting their workday later now that they no longer have to commute. Interestingly, in Italy there is an inversion of the demand curve, where the evening peak, driven by residential lighting, heating, and cooking, is pushed higher than the morning peak.
With these changes in mind, how might grid operators be coping with these unusual shifts in daily usage patterns?
In Figure 3, we can see the hourly percentage demand forecast error averaged over weekdays for each week in March.
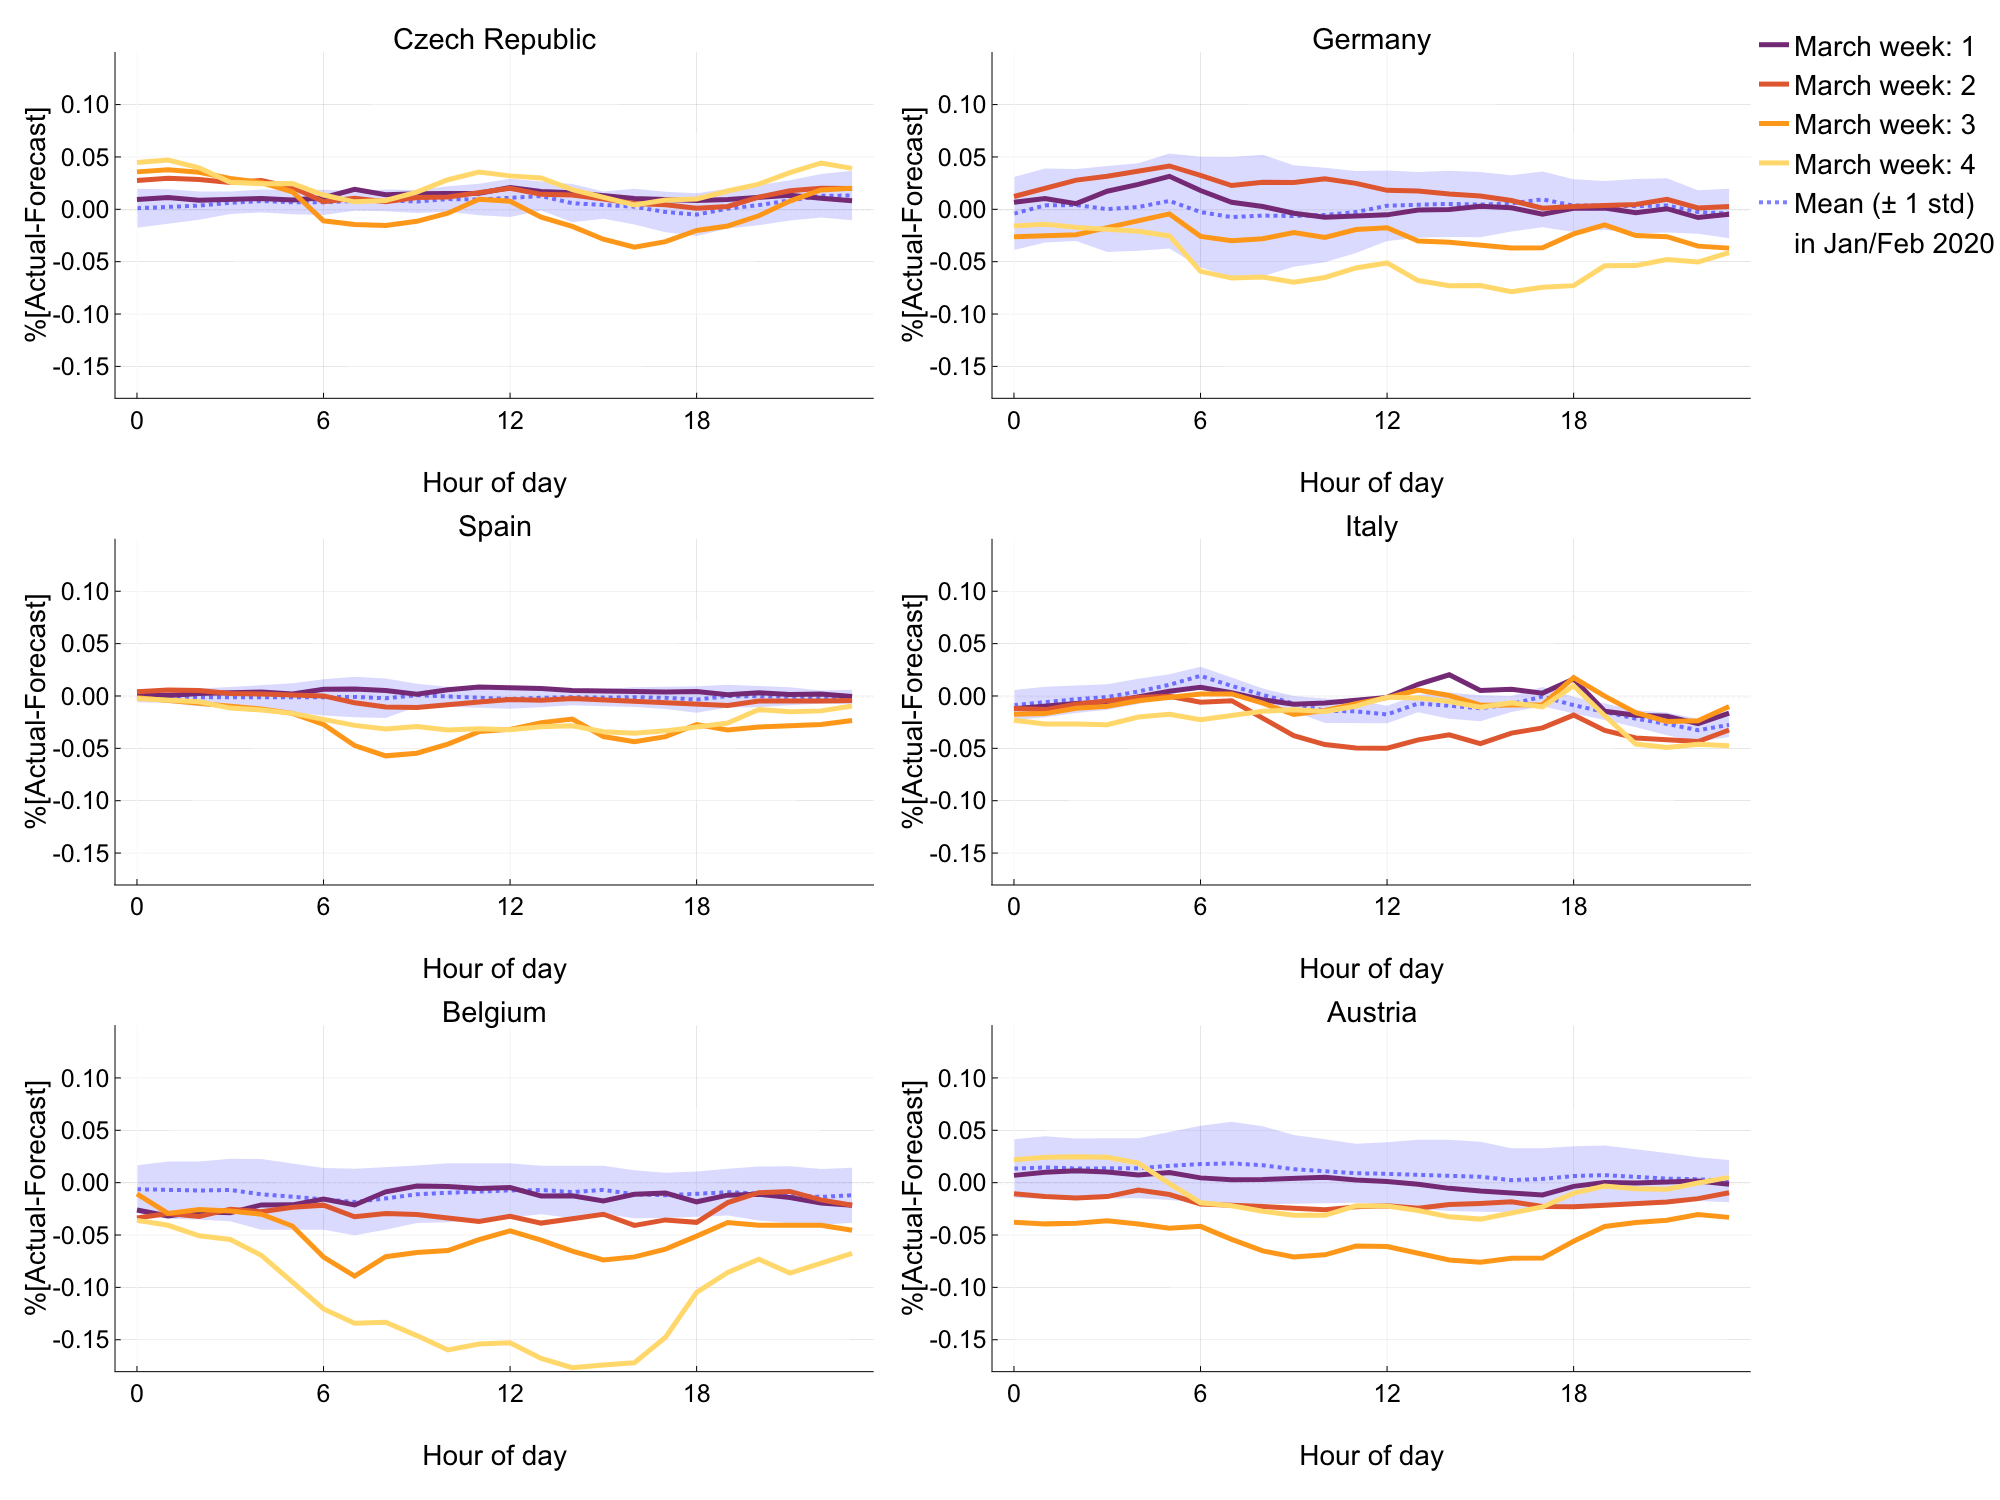 Figure 3: Hourly percentage demand forecast error, averaged over weekdays in each week of March (coloured), and all subsequent weeks leading up to March (black/blue).
Comparing to the distribution of hourly percentage forecast errors for all weeks in 2020 up until March, we see some striking differences. It’s clear that the latter half of March has proven difficult to forecast for transmission system operators (TSOs), due to the unusual changes in daily energy use. It’s likely that this has increased congestion in electricity grids across Europe, as TSOs are planning for higher loads than are seen in real time. Planning to provide more power than is required leads to over-commitment of energy resources which increases the economic and environmental cost of electricity markets, as congestion prices increase and renewable energy is curtailed to prevent transmission line overloading. It will be interesting to see how long it takes for TSOs to adjust to the new norms in daily energy use.
Conclusions
In part 1 of this series, we’ve explored electricity demand data for several European countries and how the restrictions imposed to limit the impact of coronavirus are affecting both usage of electricity and TSO planning. Not only is there a clear decline in electricity demand, we also observe notable changes in daily demand profiles, indicating a marked shift in the peak hours for electricity usage. In addition to this, we’ve seen that such drastic and uncertain changes in when and how much power will be consumed have caused forecasting problems for transmission system operators, which may be reducing economic and environmental efficiency in European electricity systems.
In part 2, we’ll explore how changes in electricity demand have affected the energy mix in Europe, and whether or not this has affected the overall emissions of European electricity systems.
-
We would have liked to include France, but records of the demand stop on the 18th of March, one day after national lockdown was imposed. ↩