 Invenia Blog
European Energy Mix and Emissions in the Face of National Lockdowns
17 Apr 2020In Part 1 of this series on how national lockdowns have affected electricity markets and system operations, we discussed how declining demand has changed the daily patterns of electricity usage in Europe, and the challenges this brings to electricity system operators. With Covid-19 continuing to cause widespread shutdown of businesses and public institutions around the world, we are seeing a marked decrease in the demand for electricity 1,2. In this post we will explore how the different types of power generation in several European countries are being affected by declining energy demand, and how this may be affecting pollutant emissions from European electricity systems. Furthermore, we will see how oversupply of energy, due to reductions in demand, is affecting wholesale energy market prices.
How have national lockdowns affected electricity production?
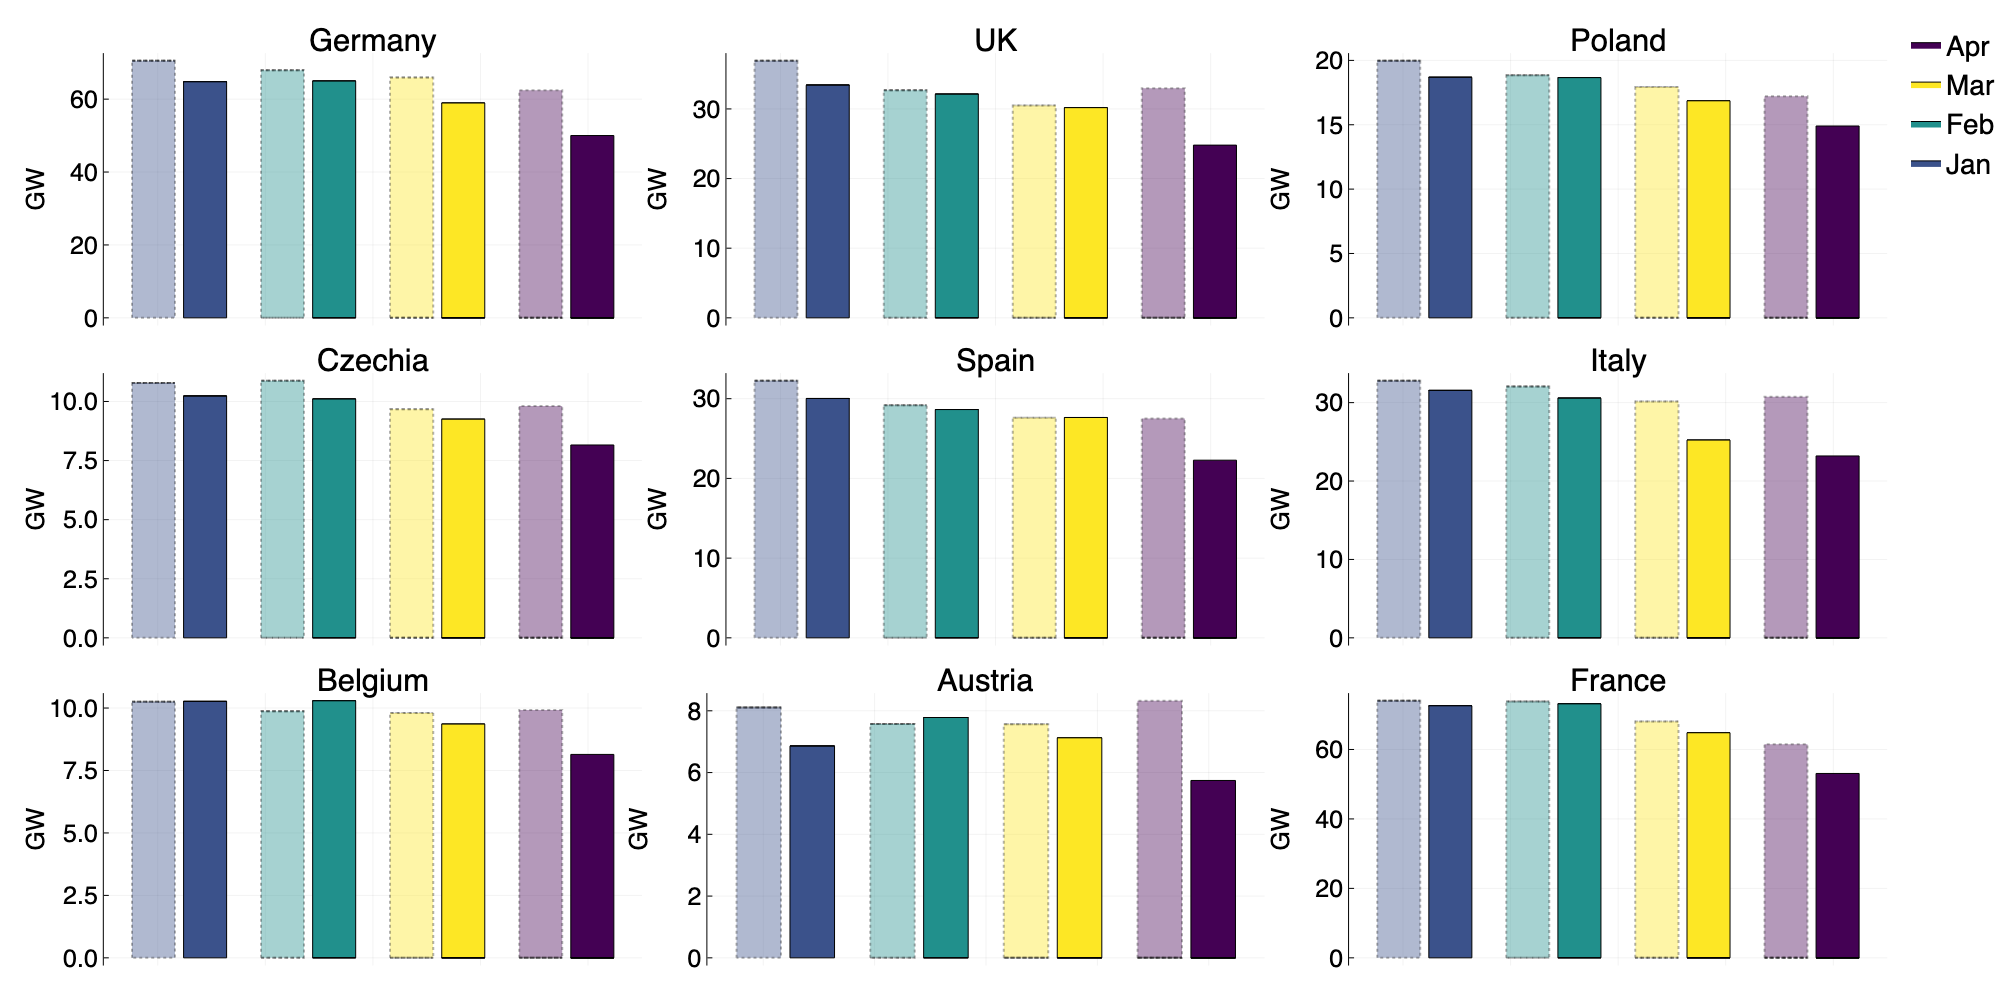 Figure 1: Average hourly electricity generation from all sources in the first 4 months of 2020 (solid), and 2019 (faint).
Looking at the average hourly electricity generation per month (Figure 1), we observe a significant decline in energy production compared to 2019 for both March and April. The generation of electricity comes from various sources, such as nuclear or coal power plants, defining what is called the generation fuel mix. Given the striking decline in overall generation, the question arises of how this affects the generation fuel mix.
First, however, there is another important factor that influences electricity demand, and therefore generation. Demand for electricity is weather-dependent and, after a relatively mild winter and an early spring, it is reasonable to consider that a portion of the reduction in demand may be due to increased temperatures. In our analysis we are concerned with the temperature differences between the early spring of 2020 and the same period in 2019. Differences between European temperature anomalies3 for March 2019 and March 2020, are approximately 1˚C, and, as mentioned in part 1, a high estimate of the effect of temperature on demand is of 1.5-2.0% decrease per 1˚C temperature increase4.
After accounting for temperature effects, there are still differences in the generation fuel mix that suggest effects from the demand reductions caused by nationwide lockdowns. In order to understand this, we must first review the dynamics of the generation fuel mix during normal circumstances. Typically, an increase in generation from renewable sources, such as wind and solar, leads to decreases in production from fossil fuels, most often from natural gas or coal. Looking at the data for Germany in February (Figure 2), we see roughly a 5GW decrease from both hard and brown coal generation. However, this is accompanied by a staggering ~10GW increase in wind generation5. We see a similar situation for the UK, where ~4GW of wind generation has displaced gas production in both January and February of 2020. An indication of an overall decrease in demand is a reduction in generation from one power source that is not compensated by an increase in generation from other sources. This is precisely what we observe for many countries in April 2020. Hard and brown coal generation in Germany once again show a ~5GW decrease, yet there is no increase in production from any other source. The UK has seen a ~5GW drop in gas production, with no renewable generation to replace these losses. Italy, Belgium and France also show large reductions in gas generation, whilst the Czech Republic, and Poland see reductions in brown and hard coal respectively.
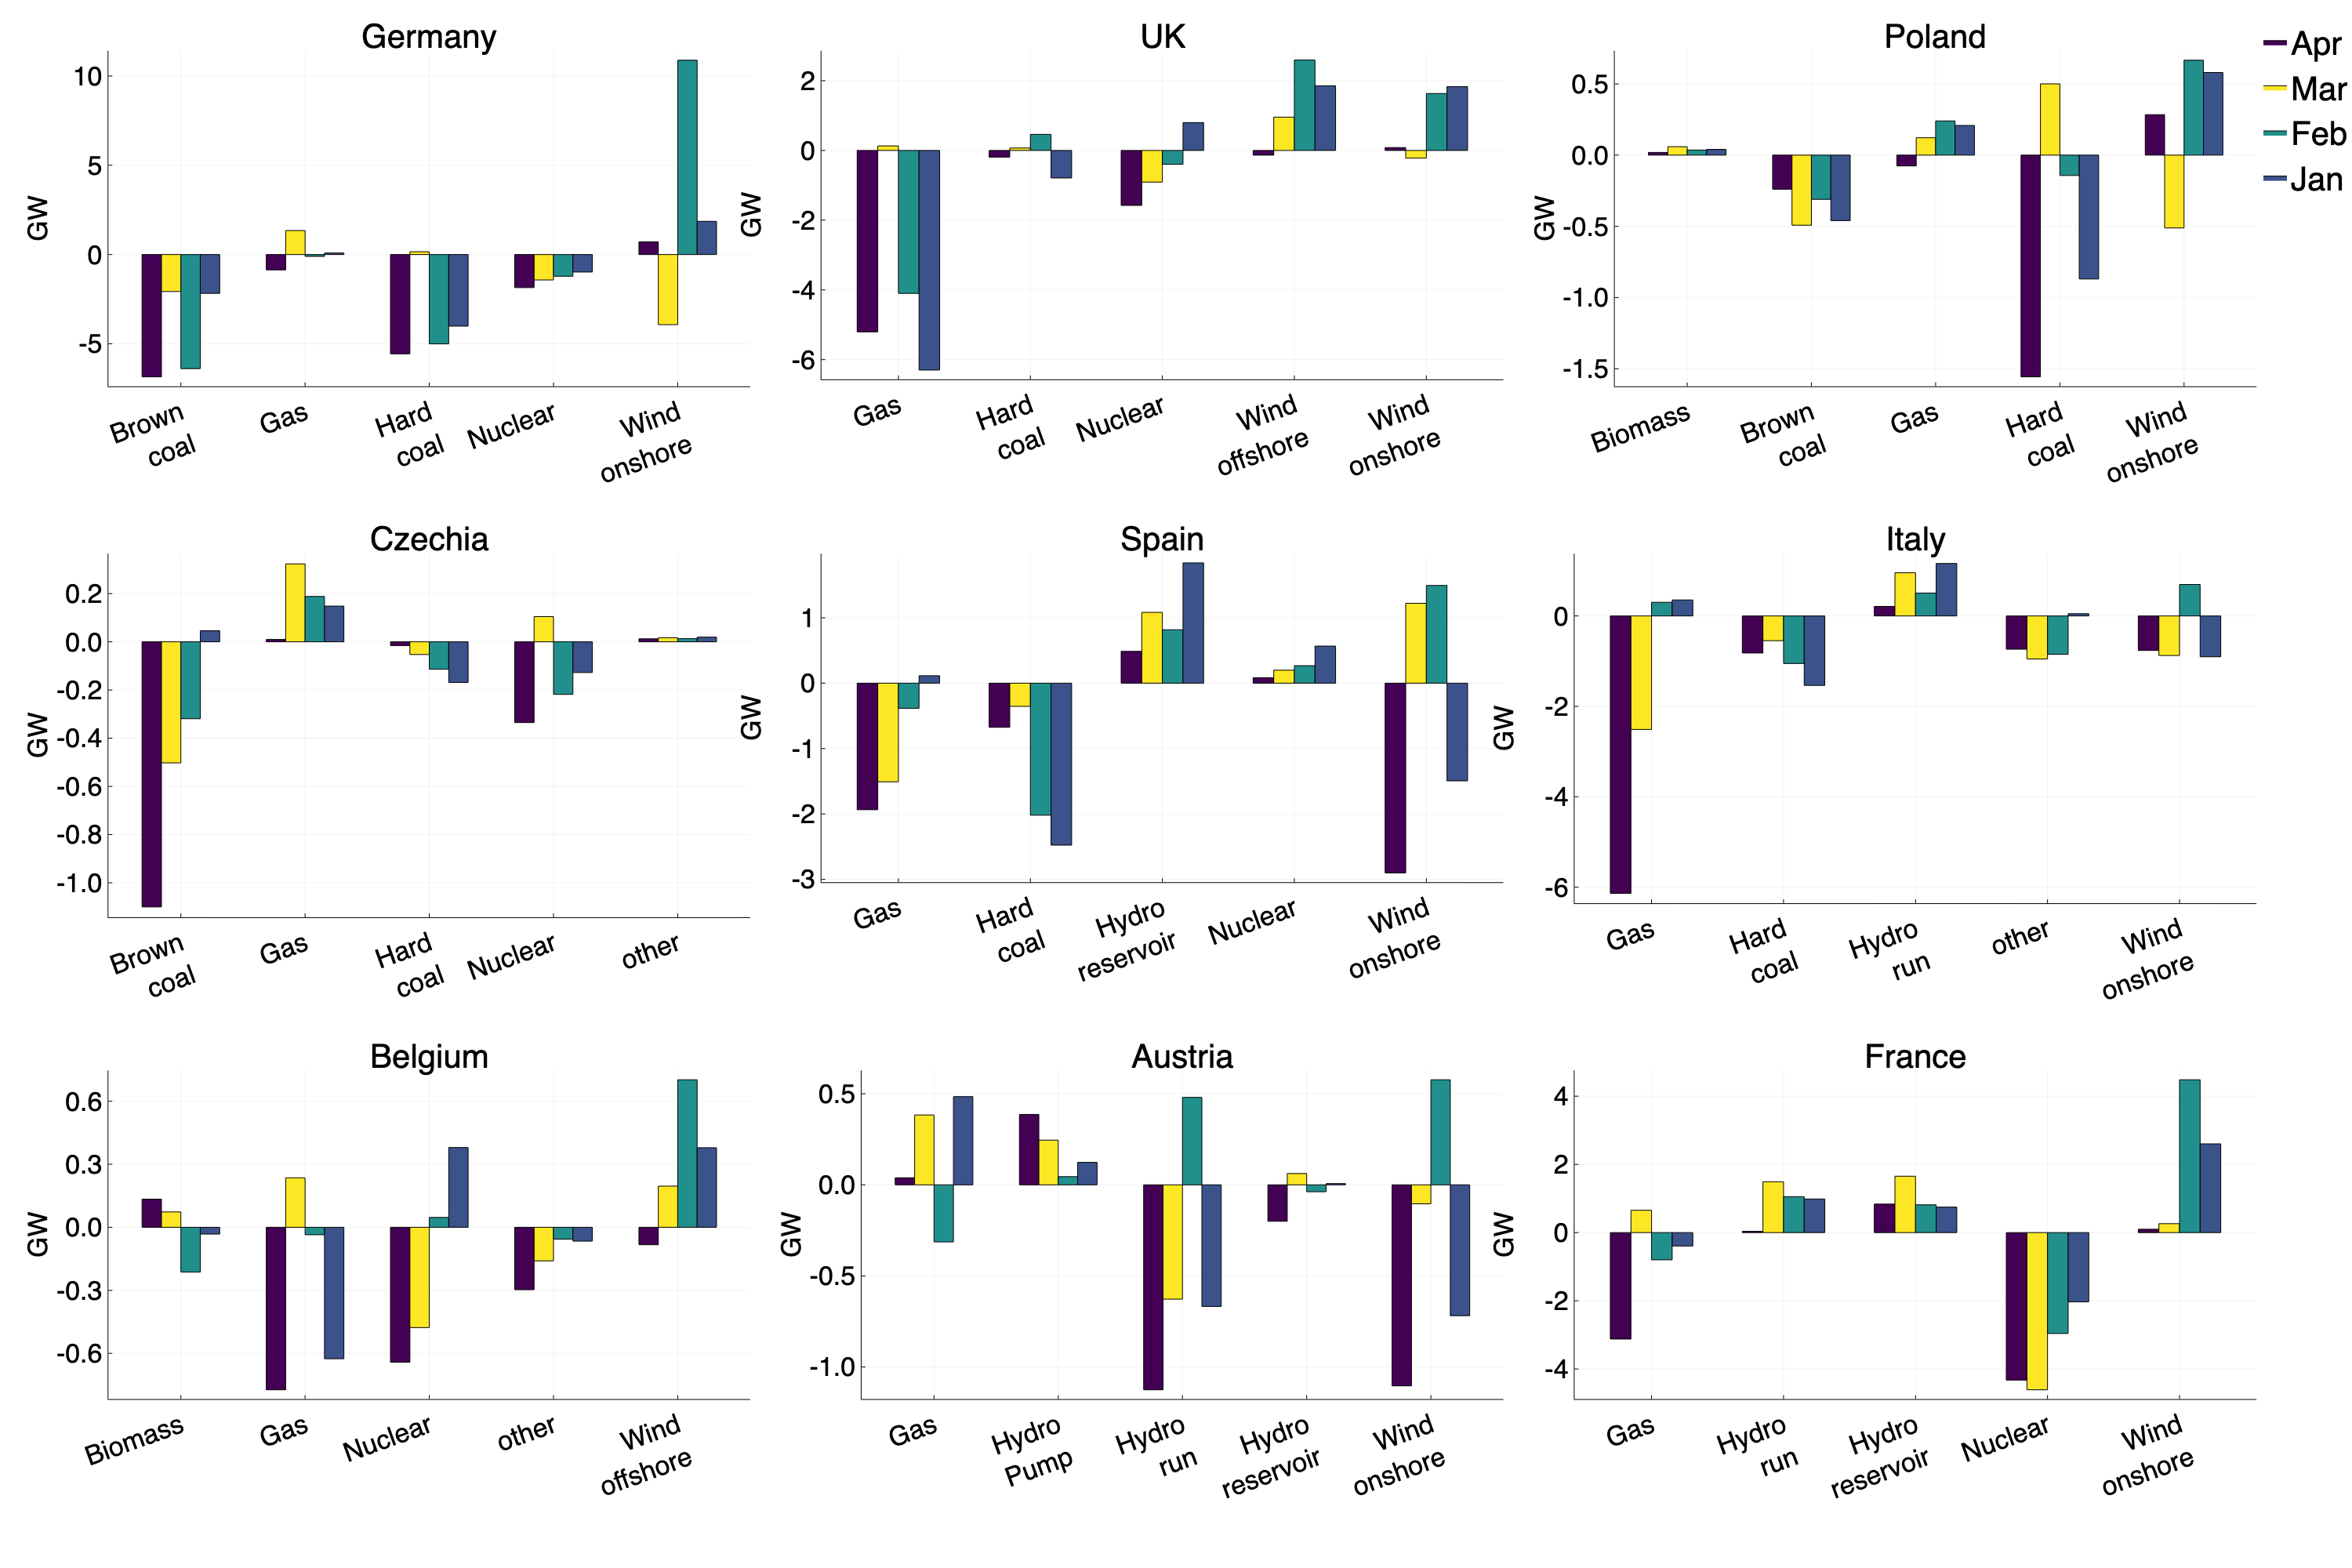 Figure 2: Difference in average hourly generation by fuel type between 2020 and 2019 by month.
We only discuss the top 5 contributors to the energy mix, as these have the most impact.
Figure 2: Difference in average hourly generation by fuel type between 2020 and 2019 by month.
We only discuss the top 5 contributors to the energy mix, as these have the most impact.
How might this be affecting carbon emissions of European electricity systems?
Given the reductions in gas and coal production as a result of decreased demand caused by national lockdowns, we can estimate the effect of lockdowns on emissions produced by electricity generation. In order to make such estimates we use what is known emissions factors for each fuel type. The emissions factor for a fuel type tells us the mass of carbon dioxide emitted per kilowatt-hour (kWh) of energy produced using that fuel. Detailed emission factors can be found here but for our rough estimates we use values of \(0.2\ kg CO_2 / kWh\) and \(0.3\ kg CO_2 / kWh\) for natural gas and brown/hard coal, respectively. Taking Italy as an illustrative example, where lockdown has been in place for the majority of March and April, we see an average decrease of ~4GW in hourly gas generation (across both months). Thus, the hourly reduction in emissions is given by the emissions factor for gas (\(E_g\)) multiplied by the reduction in generation (\(G_r\)) .
\begin{align} E_g \times G_r & = 0.2\ kg CO_2 / kWh \times \text{4,000,000}\ kW \nonumber \\ & = \text{800,000}\ kg CO_2 /h \nonumber \end{align}
Our estimate comes to an average of 800 tonnes less of \(CO_2\) emissions for every hour during lockdown. If we assume these restrictions will last for 8 weeks (1344 hours), the total reduction over the whole lockdown period would be ~1.1M tonnes. To put this into perspective, the annual average emissions per capita in Europe is ~6 tonnes, meaning the reductions observed over the 8 weeks, are equivalent to the yearly emissions of ~180,000 people. Applying the same method across all countries, we see that national lockdowns across Europe have reduced \(CO_2\) emissions from electricity generation equivalent to the annual emissions of nearly 1 million people (Table 1), or roughly 6M tonnes. Our analysis shows how reductions in electricity generation will play a role in making 2020 a record year for reducing carbon emissions.
Table 1: Reductions in emissions for each country due to the decline in electricity production by fuel type. Note that we see no significant reduction in the fossil based generation in Austria.
| Country | Reduction in gas (GW) | Reduction in coal (GW) | CO2 emissions saved (Mt) | Equivalent number of people |
|---|---|---|---|---|
| Italy | ~4 | - | 1.1 | 215000 |
| Spain | ~1.5 | - | 0.4 | 67000 |
| France | ~3 | - | 0.81 | 134000 |
| Germany | - | ~4 | 1.61 | 268000 |
| Poland | - | ~1 | 0.4 | 67000 |
| Czechia | ~0.7 | - | 0.19 | 31000 |
| Austria | - | - | - | - |
| Belgium | ~0.6 | - | 0.16 | 27000 |
| UK | ~2.5 | - | 0.67 | 112000 |
How has this changed the overall energy mix and how might this be affecting electricity markets?
Overall, the declining power demand is having a disproportionate effect on power generation from fossil fuels. We see a stark effect in Italy, where non-fossil sources are now serving over half of the demand, compared to less than 40% seen in previous months. In the UK and Germany, the percentage of generation from non-fossil sources is on par with what we saw during in February, where both countries saw huge surges in wind power generation.
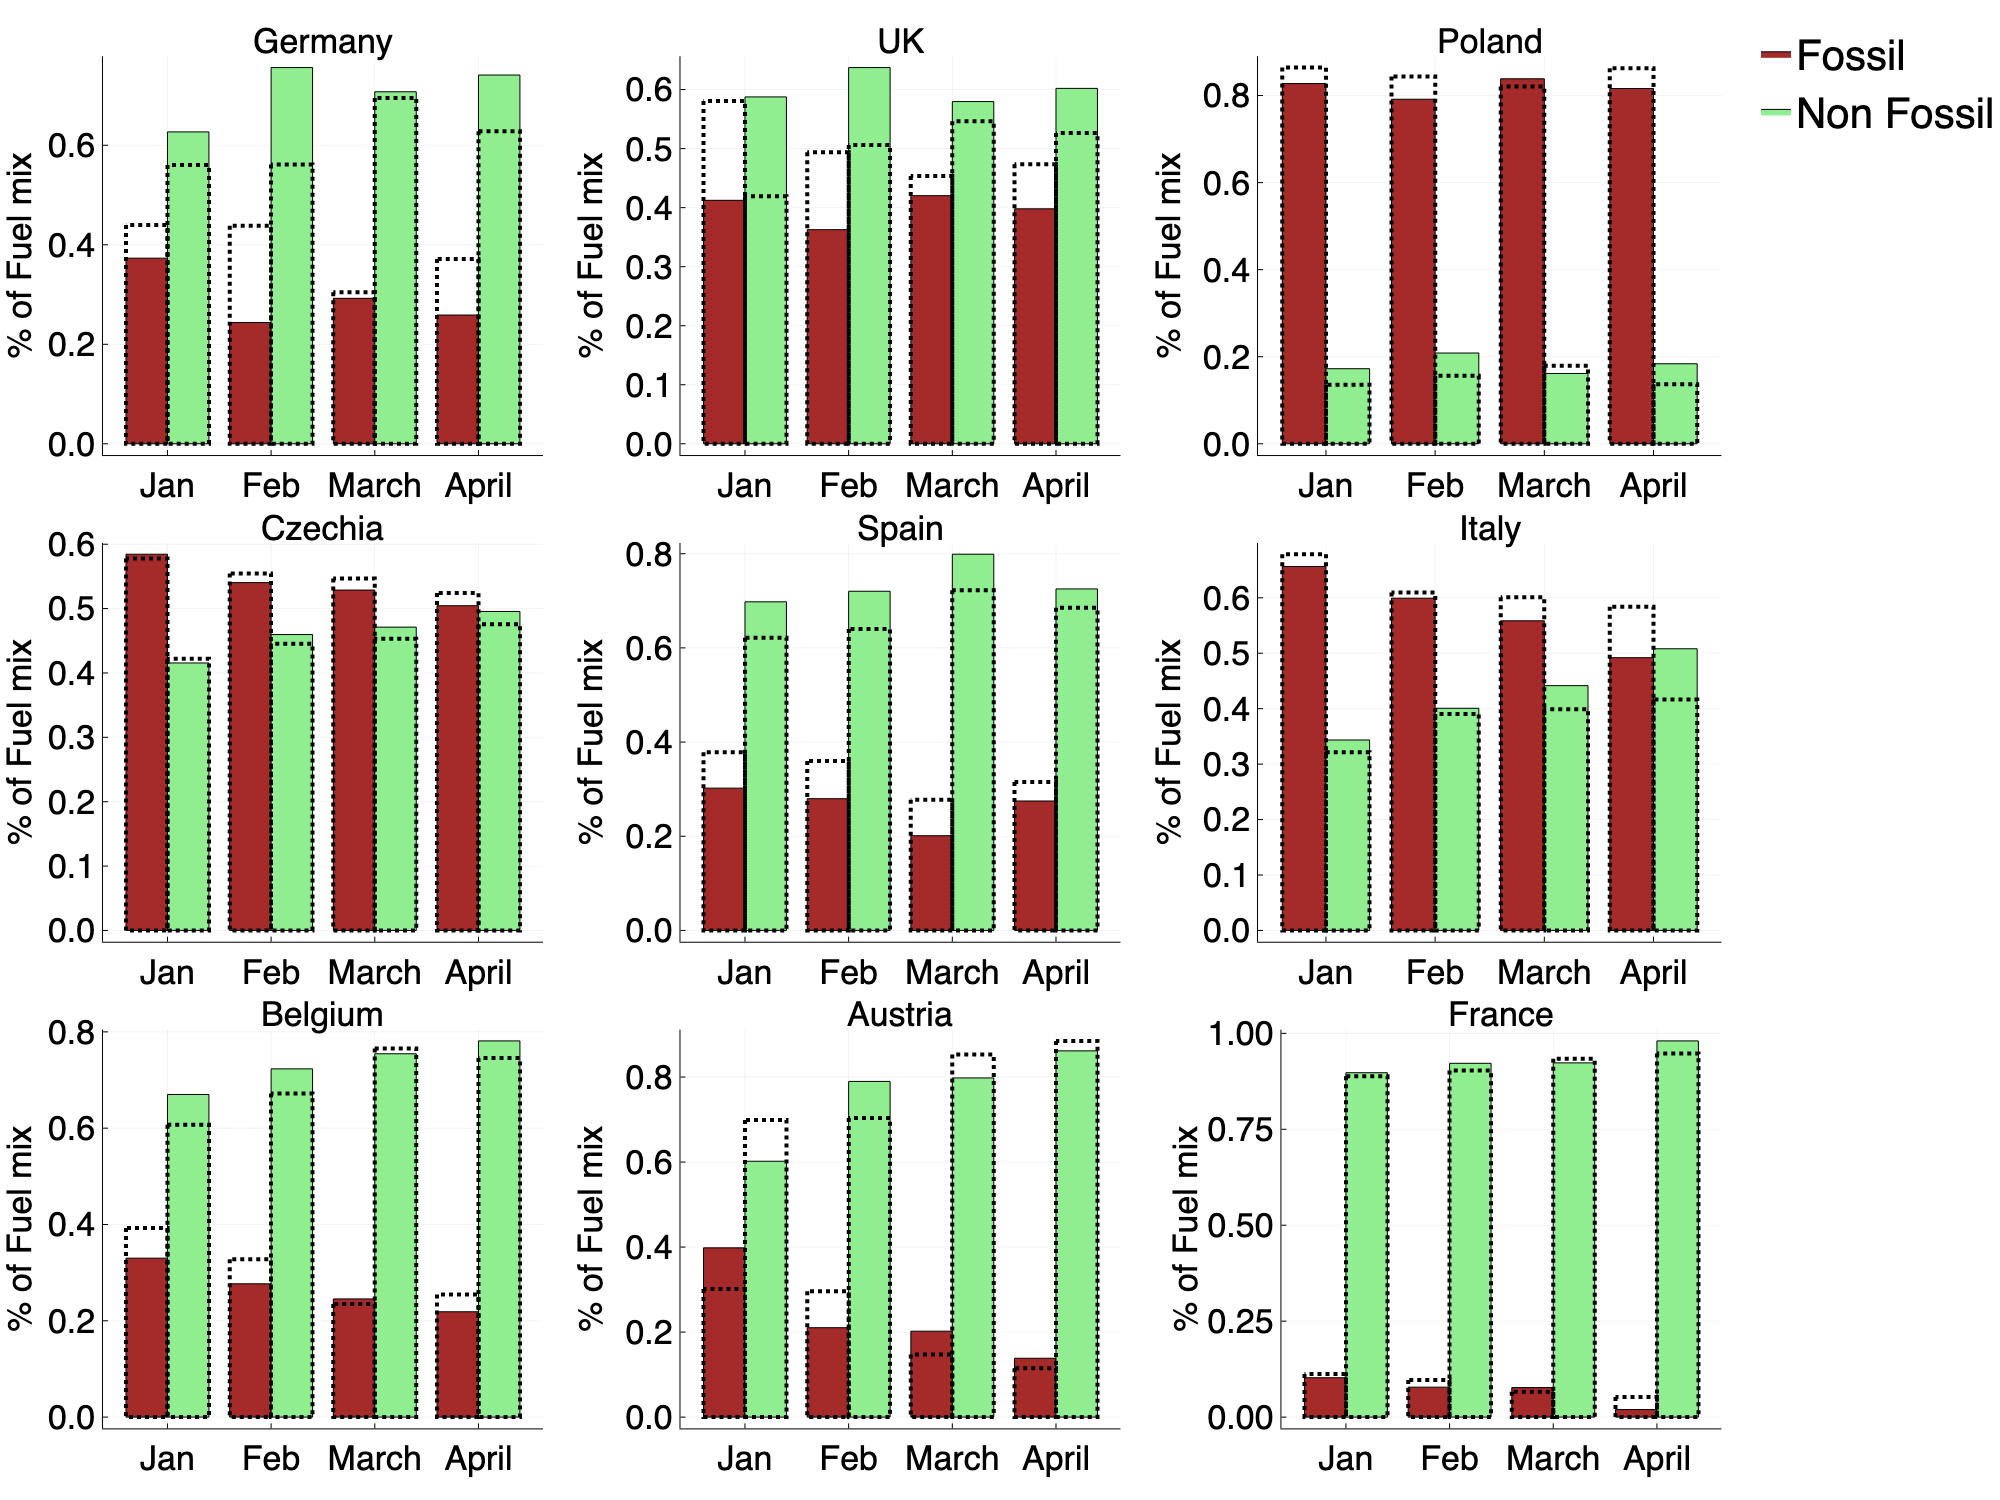 Figure 3: Hourly average percentage of the fuel mix for both fossil (brown) and non fossil sources (green). The 2019 values are indicated by the dotted lines.
Combining a high percentage of renewable energy output, with a drastic reduction in electricity demand creates an unusual situation for electricity system operators. The variability in renewable generation coupled with unprecedented reductions in the demand for electricity, creates a situation where generation plants may have to pay to provide electricity, as opposed to being paid to do so. In many European electricity markets, the price for unplanned electricity supply or demand is known as the imbalance price. In almost all cases, the imbalance price is positive, where generators are paid to provide power to ensure supply meets the demand. However, when there is an overwhelming surplus of power, the imbalance price can fall below zero. In such cases, electricity system operators set negative imbalance prices to motivate generators to halt production, by forcing them to pay to provide electricity. During March and April, we see spikes in the frequency of negative imbalance prices in several European countries (Figure 4), indicating that there is a large surplus of available power and less incentive for suppliers to generate electricity.
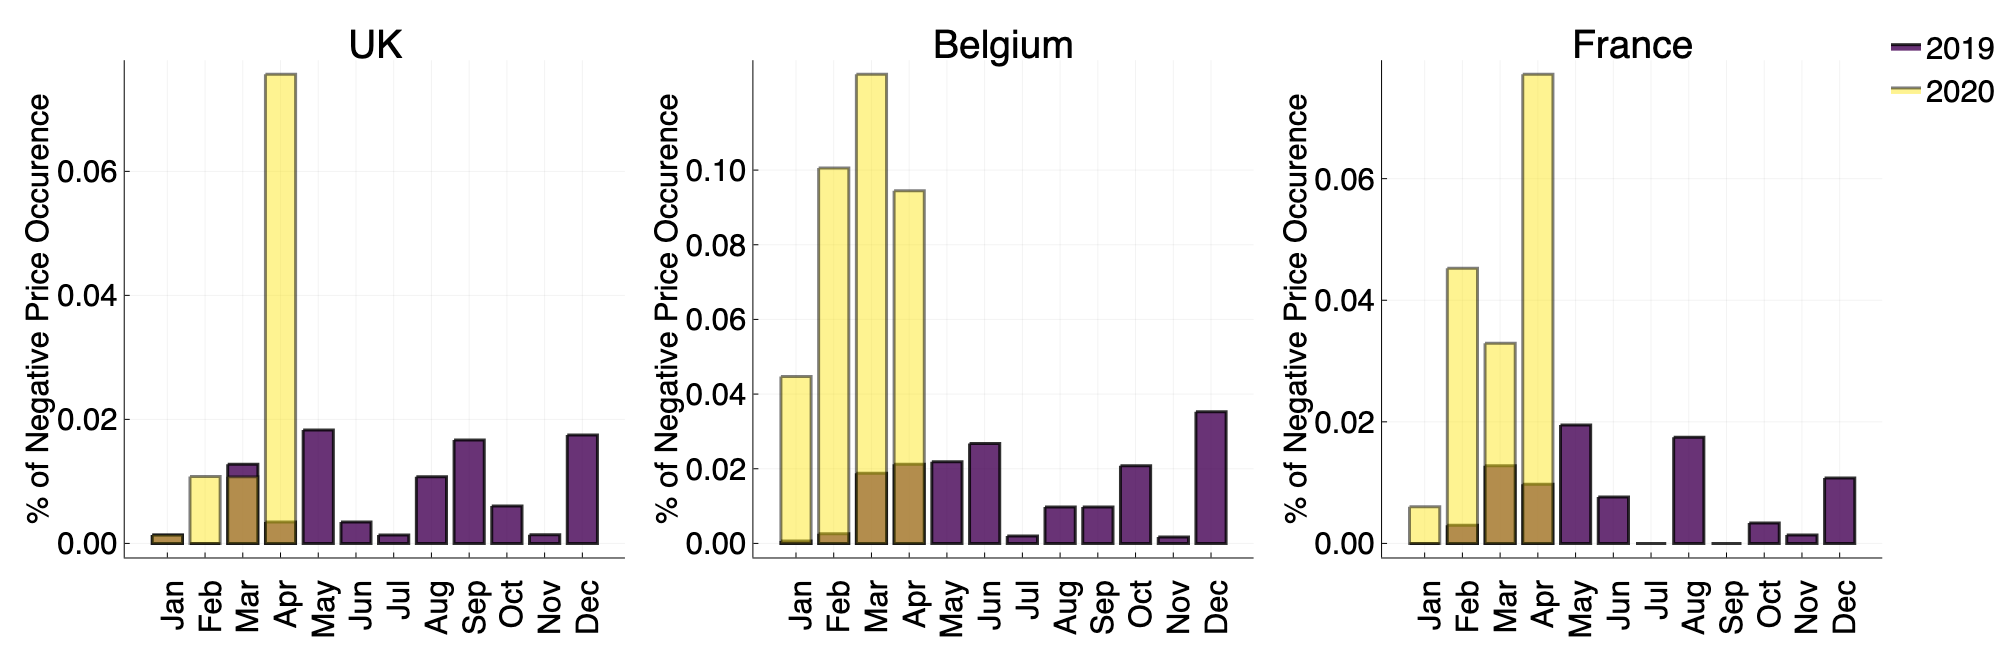 Figure 4: Percentage of negative imbalance prices per month for 2019 (blue) and 2020 (yellow).
Conclusions
In the second part of this series, we have explored how restrictions due to Covid-19 have affected the generation mix of several European countries. We find a disproportionate reduction to the output from both coal and gas power plants and estimate a decline in carbon emissions equivalent to that of the annual emissions of nearly 1 million people. Furthermore, the impact of reduced fossil generation has led some countries to see a cleaner energy mix than normal, which, combined with record low demand, has led to electricity system operators acting to disincentivize the production of electricity.
In part 3, we will look at the United States, to see how electricity systems there are changing in the country currently hit hardest by Covid-19.
-
https://invenia.github.io/blog/2020/03/31/covid-part1/ ↩
-
https://uk.reuters.com/article/uk-britain-energy/lockdown-knocks-uk-daily-electricity-demand-by-10-grid-idUKKBN21I205 ↩
-
The temperature anomaly is defined as the difference between the temperature at a given time, \(T\), and some baseline temperature, known as a “ climate normal”, i.e \(T - T_{\text{normal}}\). Thus, subtracting the March 2019 anomaly from the March 2020 anomaly gives us the difference in average temperatures between March 2020 and March 2019. \(T_{20} - T_{\text{normal}} - (T_{19} - T_{\text{normal}}) = T_{20} - T_{19}\) ↩
-
Note that this is only the case for mild temperatures, as increases in temperature during hot days can increase demand on cooling degree days. ↩
-
If this number seems large, it should, Germany saw record breaking wind generation in February 2020. ↩