 Invenia Blog
Impacts of statewide lockdowns on the United States power grid
13 May 2020In the first two parts of this series we looked at the effects of national lockdowns on electricity usage and production, and in particular how European energy demand has decreased significantly. This decrease has caused a sharp decline in power production from fossil fuels compared to renewable sources and led to emissions reductions equivalent to the annual carbon footprint of approximately 1 million people.1
In this post, we turn our attention to the United States and review how the changing patterns of energy use have impacted planning and the environmental efficiency of electricity systems. We’ll then look at how the generation fuel mix has changed due to a rare abundance of available energy, and the effects this has on wholesale electricity markets.
As of May 7th 2020, the United States as a whole has been the country worst affected by Covid-19. However, statewide lockdowns have differed in both when they were introduced, and the severity of the imposed restrictions. The first states to issue stay-at-home orders did so on March 21st, and by April 5th a large majority of the US was under partial or full lockdown. With this in mind we first look at how these restrictions have affected the demand for electricity.
Declining Demand
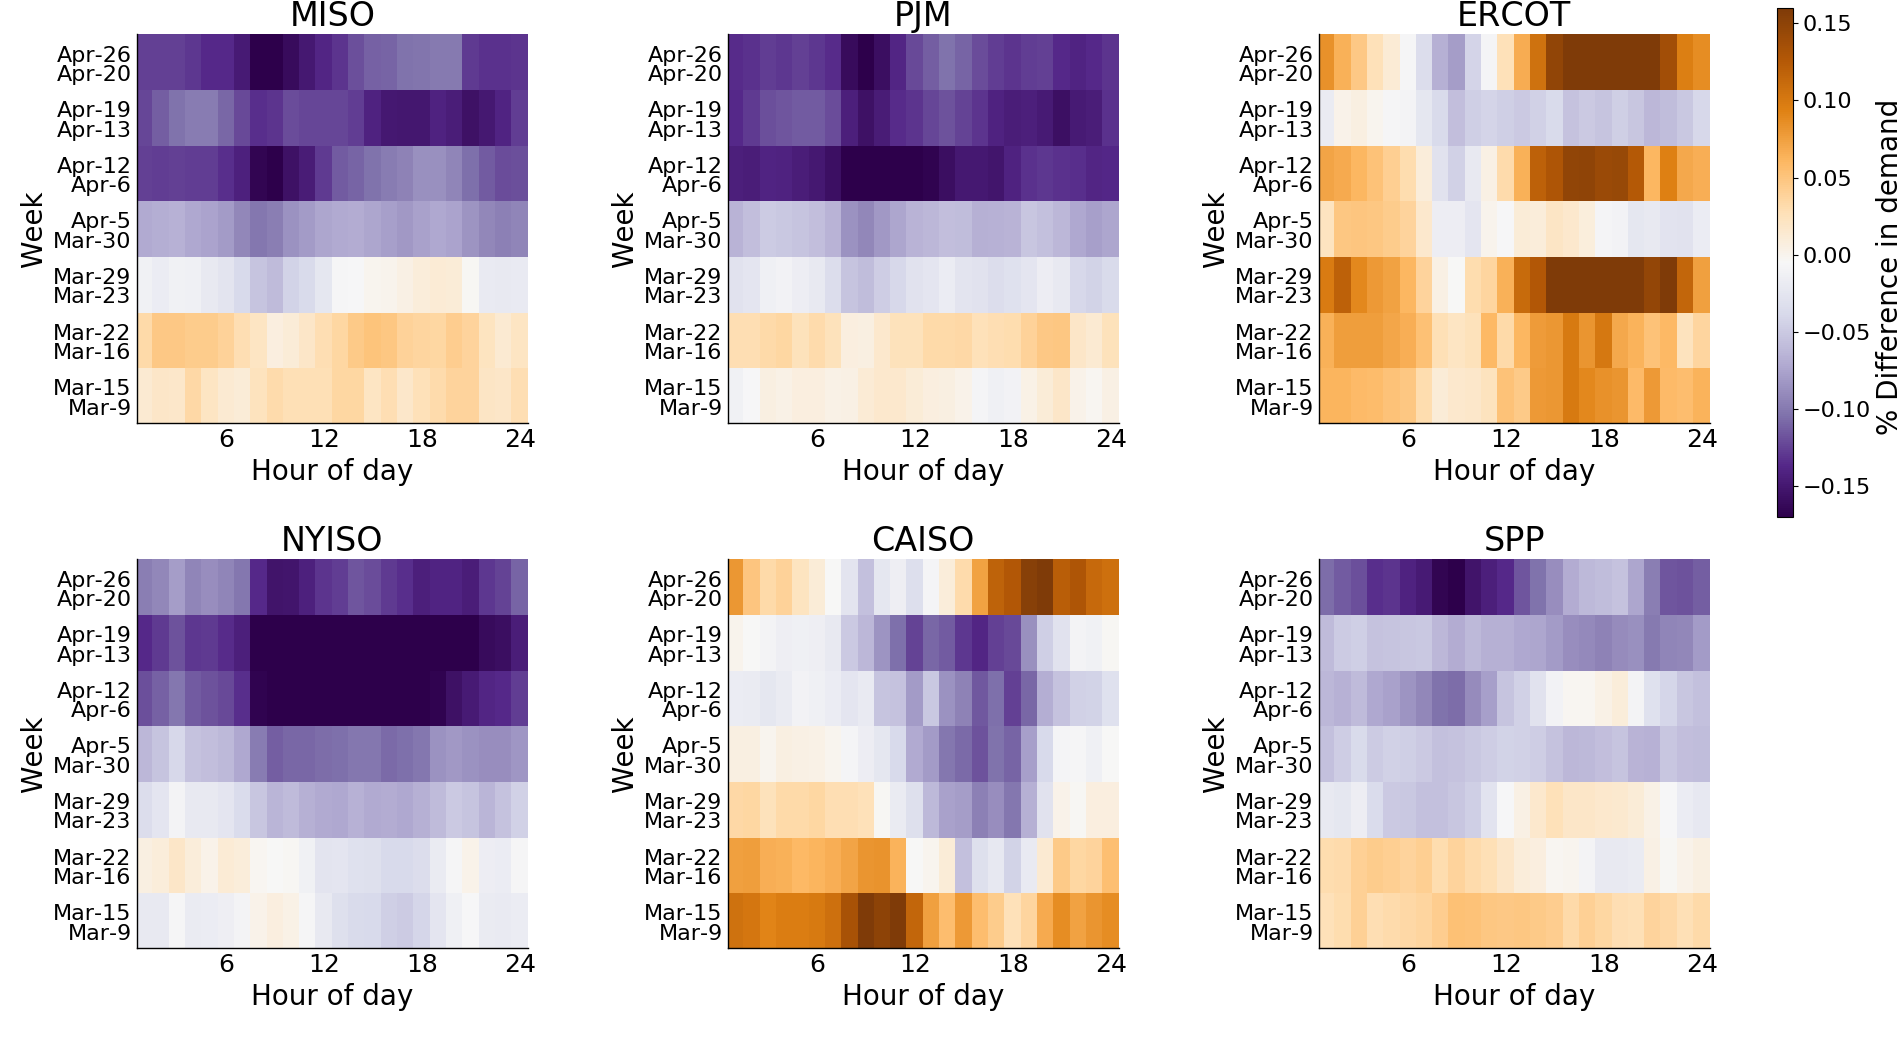 Figure 1: Percentage difference in demand by hour of day in March and April 2020 compared to 2019. A linear temperature adjustment has been applied to correct for demand reductions due to increases in temperature.2
As was the case for many European countries, demand for electricity has decreased across most of the United States during April 2020 (Figure 1). Electricity demand recorded by the transmission operator for New York (NYISO) shows the largest decreases between the hours of 8am and 7pm, when many people would usually be either commuting or at their workplace. This data suggests that the decrease in industrial and commercial electricity demand from the closure of non-essential businesses, likely outweighs the increase in residential energy use we would expect now that many people are working from home.
For MISO and PJM, who oversee electricity systems in central and eastern states, we see reduced demand across April, with MISO showing the largest decline during the morning peak hours. The demand reported by the California Independent System Operator (CAISO) also shows reductions between the hours of 10am and 7pm. However, it is likely that a large part of this effect can be attributed to increases in behind-the-meter solar generation3 and less to do with the statewide lockdown. In Texas and the southwest, the figures reported by ERCOT and SPP break the trend and show increased demand over several weeks in April. Part of this increase is likely due to higher April temperatures in the south causing a rise in the use of residential air conditioning.
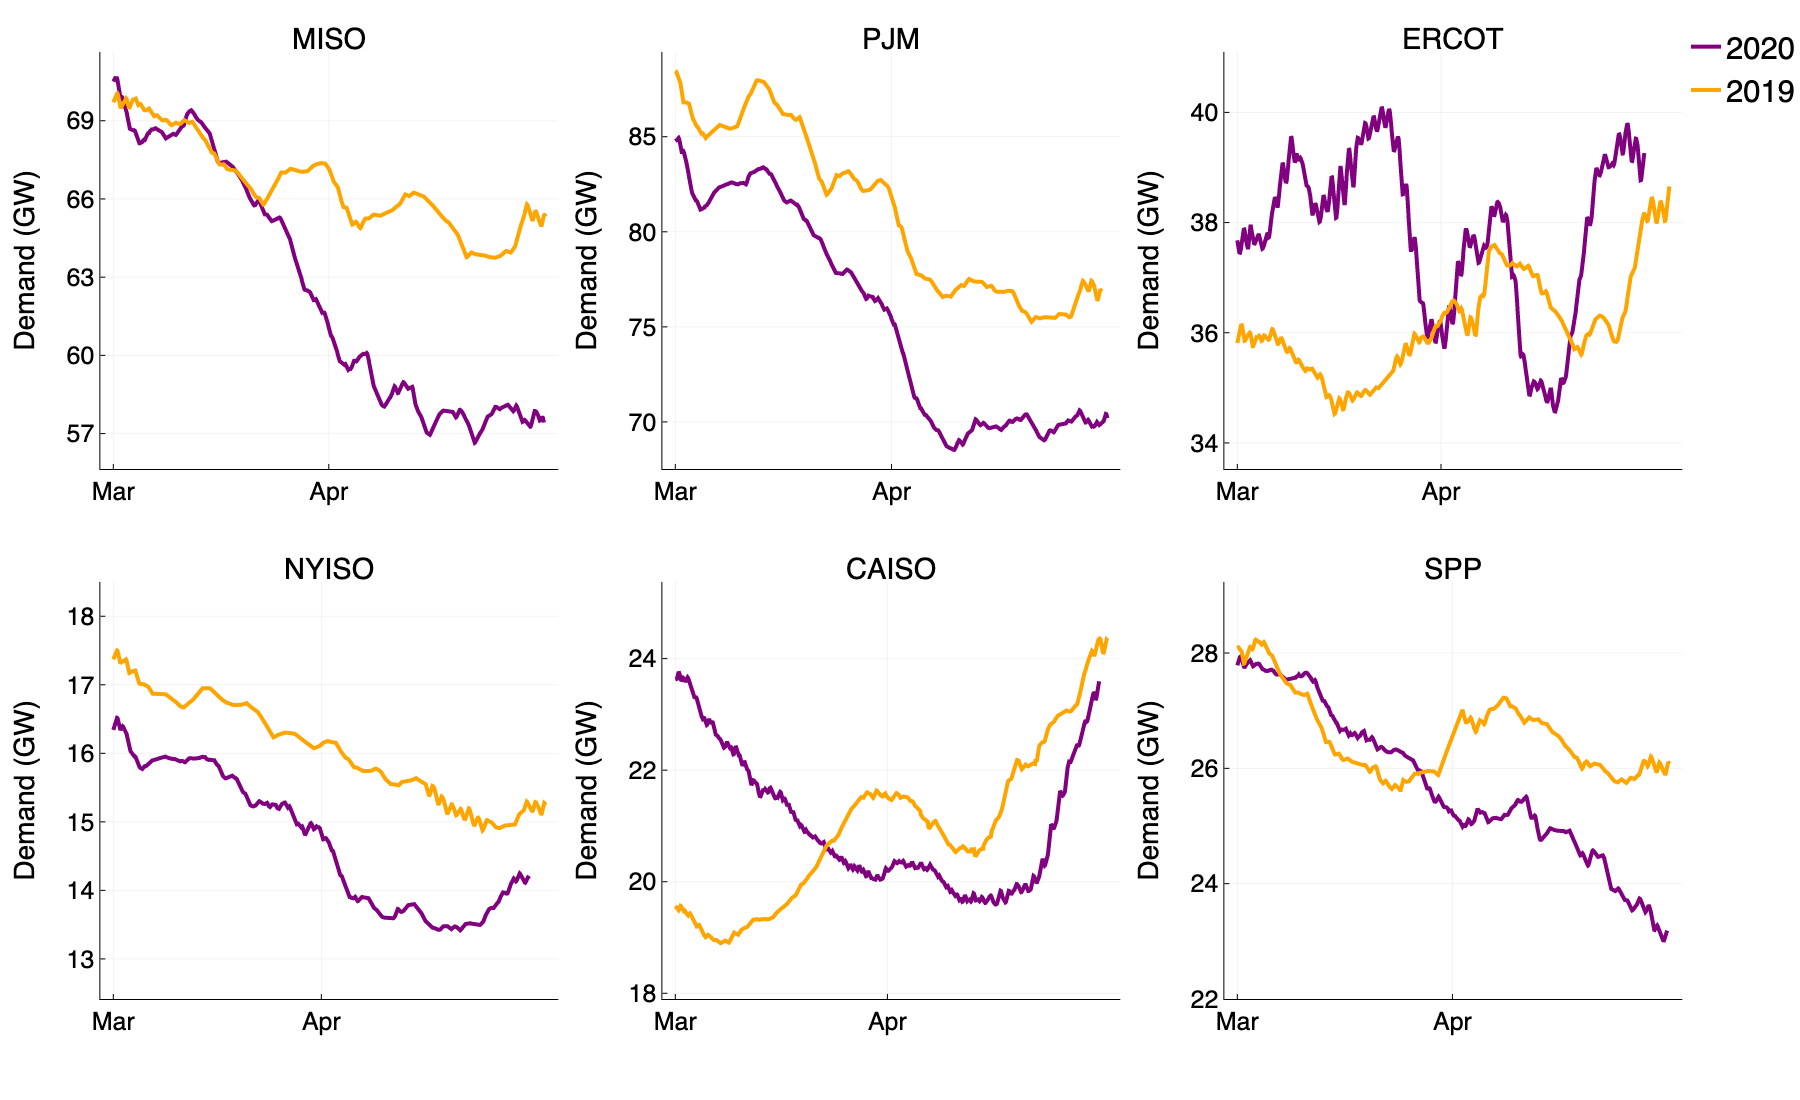 Figure 2: 7 day rolling average of electricity demand in March and April 2020 (purple), 2019 (orange).
Taking a step back to look at the long term trend in electricity demand (see Figure 2), we observe a clear turning point for some of the ISOs, coinciding with the order of statewide lockdowns. For MISO, and SPP, we see a similar demand for electricity during the majority of March, after which the demand this year begins plummeting in comparison to 2019 levels. In California, CAISO were initially reporting greater demand than in 2019, however, as restrictions were introduced during the latter half of March, a declining trend emerges which puts the 2020 demand well below what we saw last year. For the eastern ISOs, namely NYISO and PJM, the effect of lockdown on demand is less apparent, and in Texas, the demand reported by ERCOT in 2020 looks to be above the levels seen in 2019. Again, we can attribute much of this observed demand increase to a greater need for residential air conditioning, as the eastern and southern states have been experiencing a hot start to spring.
Whilst demand for electricity has decreased in the US, the effect of statewide lockdowns is not as striking as seen in Europe. This may be due to different states, which are overseen by the same ISO, introducing restrictions that vary in both severity and time of implementation, compared to the national lockdowns implemented in Europe. Nevertheless, daily patterns of energy consumption are far from the norm, and we next go on to explore how these changes are affecting electricity system planning.
How are the ISOs responding to the unusual changes to demand for electricity?
With the uncertainties in demand for electricity caused by statewide lockdowns, combined with the usual uncertainties inherent to the weather, demand forecasting for electricity has become more difficult for many of the ISOs. We find that this difficulty has led to considerably larger demand forecast errors (see Figure 3) than we have seen in previous years.
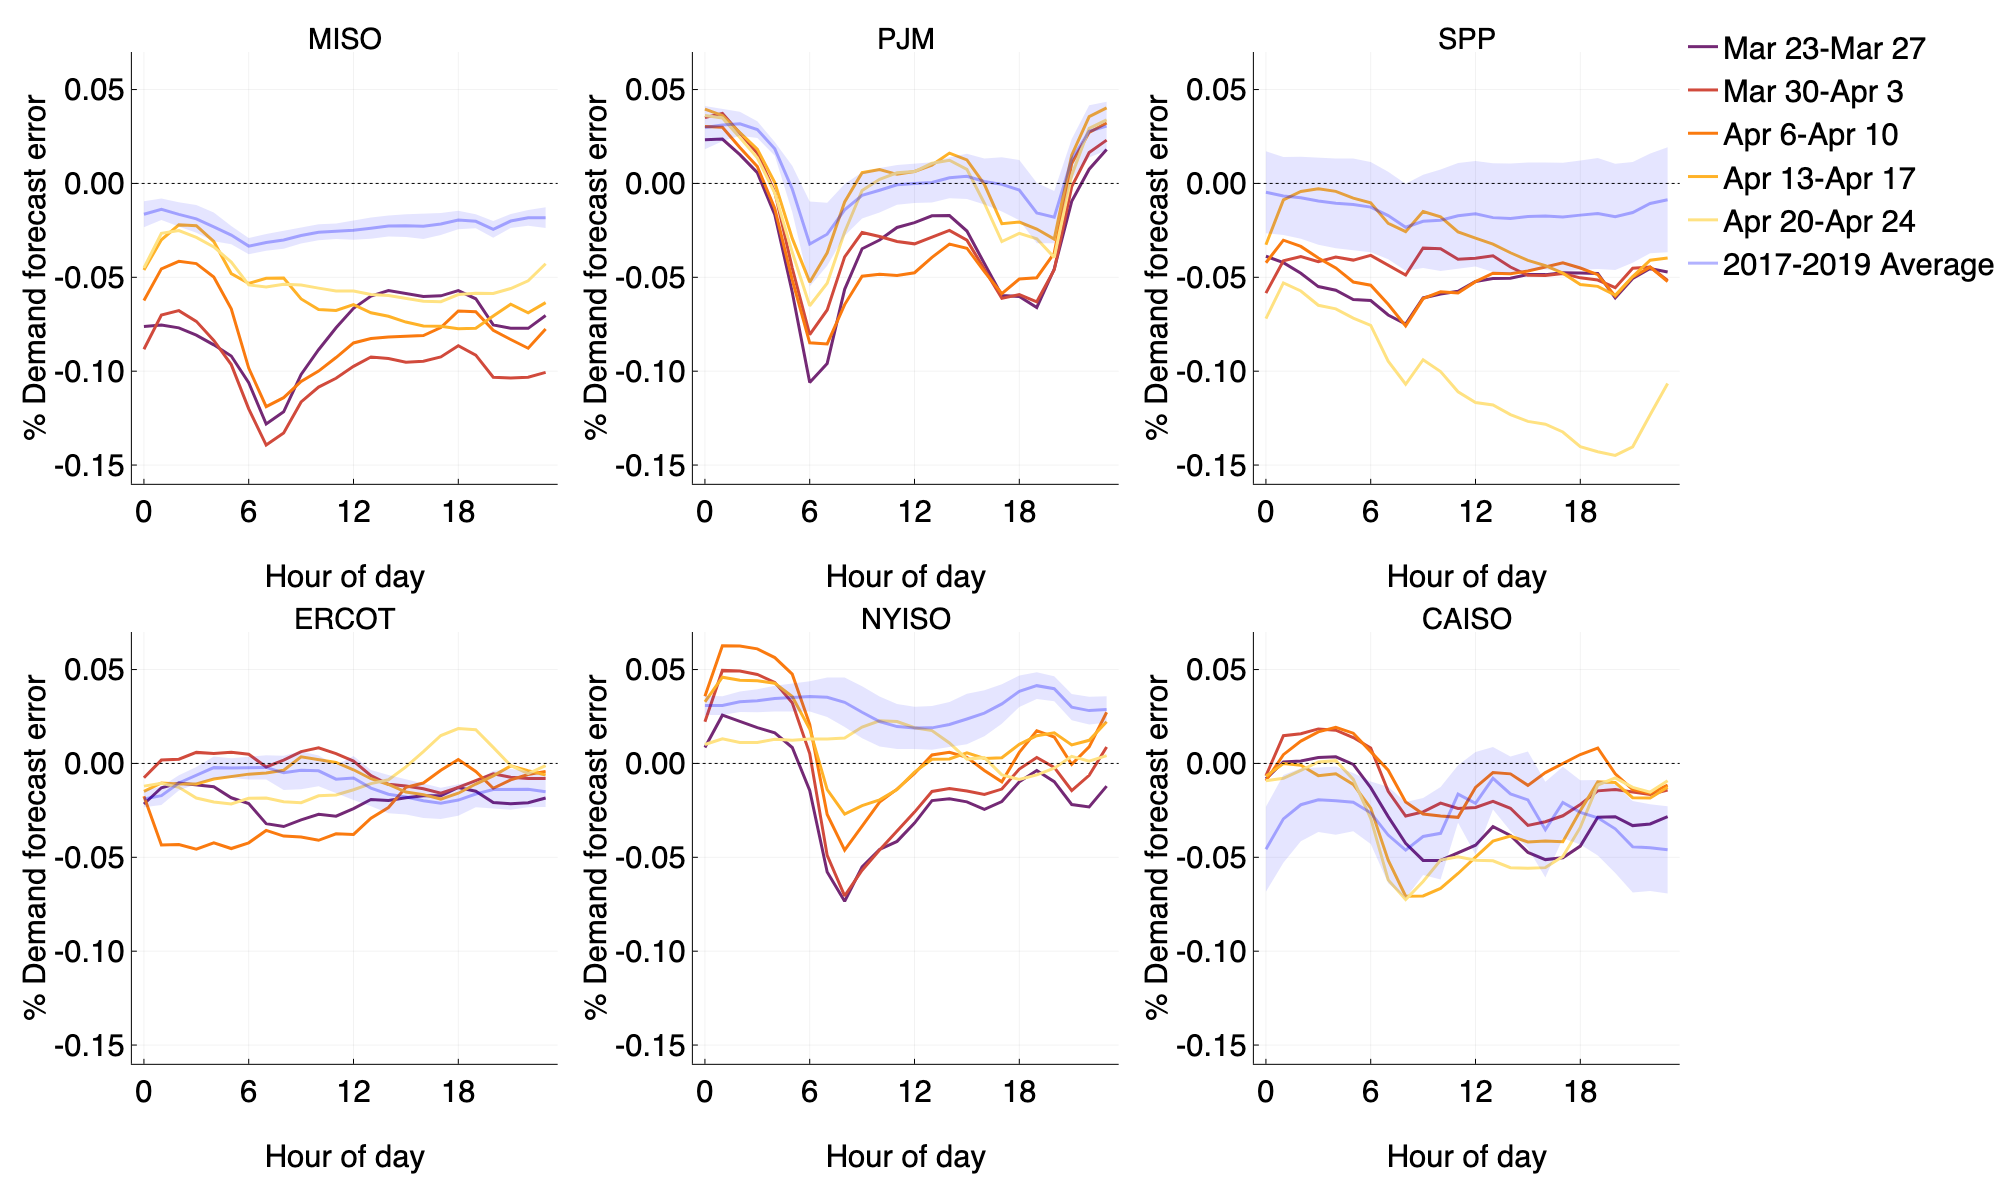 Figure 3: Hourly average weekday percent demand forecast error (\(\frac{\text{demand} - \text{forecast}}{\text{demand}}\)) over the final weeks in March and April. The 2017–2019 average over the same period is shown in blue.
The errors for MISO, PJM and NYISO clearly spike negative at 6am. This spike is due to over-forecasting the ramp up towards the morning peak demand, occurring around 9am/10am. With the shelter-in-place orders issued, these ISOs are struggling to adjust to the new morning patterns of a population now working at home. SPP looks to be less affected until the week beginning April 20th, when we see chronic over-forecasting throughout all hours of the day. This pattern is apparent in Figure 1, where the demand for electricity in SPP was relatively unaffected until the final two weeks of April.
How are these uncertainties affecting the efficiency of electricity systems?
As we discussed in the first post of this series, incorrect demand forecasts can reduce both the economic and environmental efficiency of electricity grids by causing divergence between the day ahead and real-time energy markets, and increasing the volume of energy curtailed to mitigate line congestion. Whilst we do not observe unusually large deviations between day ahead and real-time energy prices, we are seeing record breaking curtailment of combined wind and solar energy in California. Curtailment by CAISO has been growing year on year due to rising solar capacity, and previous reports indicated that this year would be no different.
Figure 4 (right) shows that curtailments in CAISO have reached ~300GWh in April 2020, soaring above the previous record of ~223GWh set in May 2019. To put this volume of curtailed energy into perspective, the average annual household consumption in the US is ~11,000kWh, which means the volume of curtailed renewable power in April is equivalent to the annual electricity usage of almost 30,000 homes. Looking at Figure 4 (left) we see that the volume of solar power produced in the first four months of 2020 is only marginally higher than the production levels seen in 2019. It is more likely that the combination of increased intermittent power production with decreased demand due to statewide lockdown, has forced CAISO to curtail more renewable power than ever before.
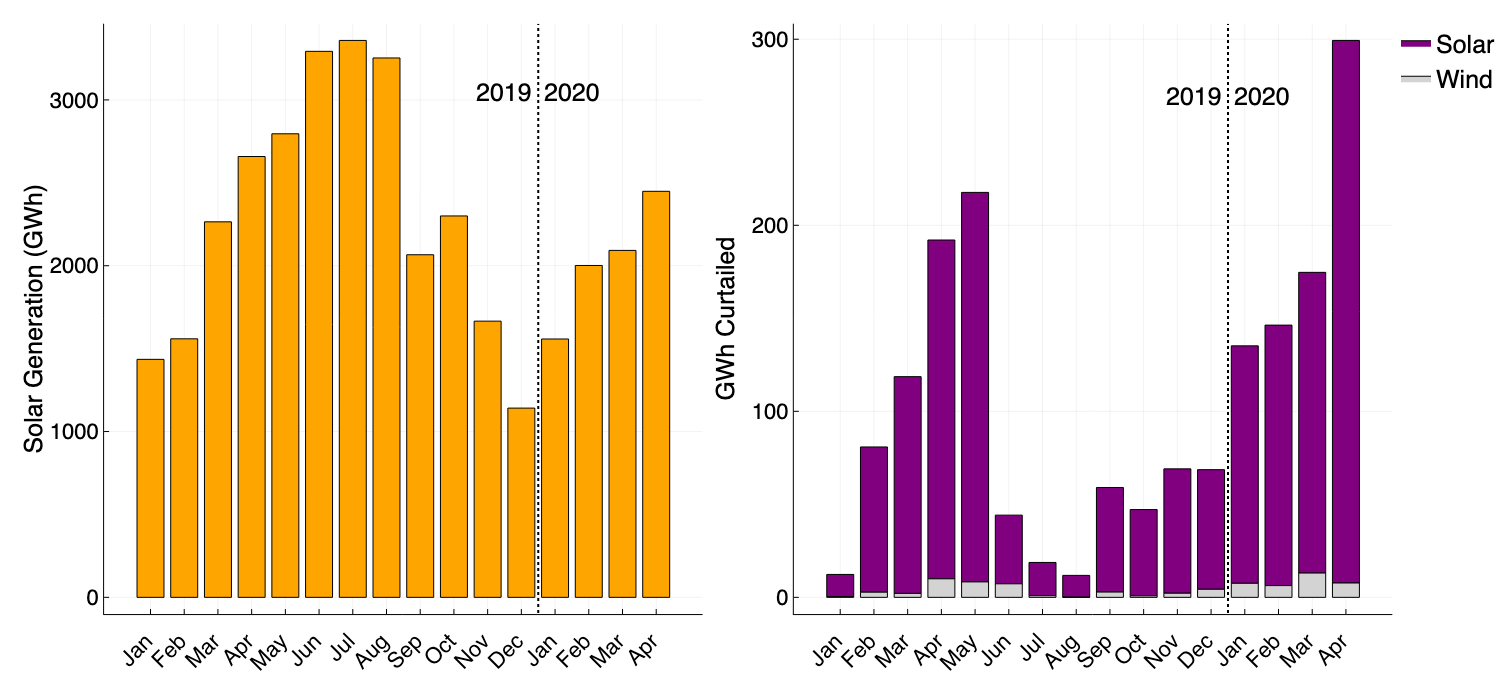 Figure 4: Left: monthly solar generation in CAISO, right: Solar and wind curtailments in CAISO throughout 2019 and 2020.
Growing curtailment of power has long been a concern for those in the control room at CAISO. This increase in wasted power highlights a lack of flexibility in the system in dealing with oversupply, and the effect of the current pandemic on reducing energy demand has amplified this further. To mitigate against additional growth in curtailment of renewable energy, and ensure less energy is wasted, utilities in California have set ambitious targets to increase grid storage capacity.
How is the generation mix changing to accommodate reduced demand?
As we saw in Europe, coal and gas based generation of electricity has declined due to national lockdowns. We find a similar pattern for PJM and MISO (see figure 5), where the hourly average production from coal has decreased ~7GW4 for both markets. Whilst some of this decrease is due to planned coal plant retirements making the way for cheaper generation technologies, the demand reductions we observe across the US are most likely to impact coal production before any other resource. This is because electricity markets are based on a type of auction, with the lowest cost generators receiving priority to serve demand. Coal powered generation is more expensive compared to natural gas and renewable production, which means coal power plants will be edged out of the auction when there is less demand for electricity.
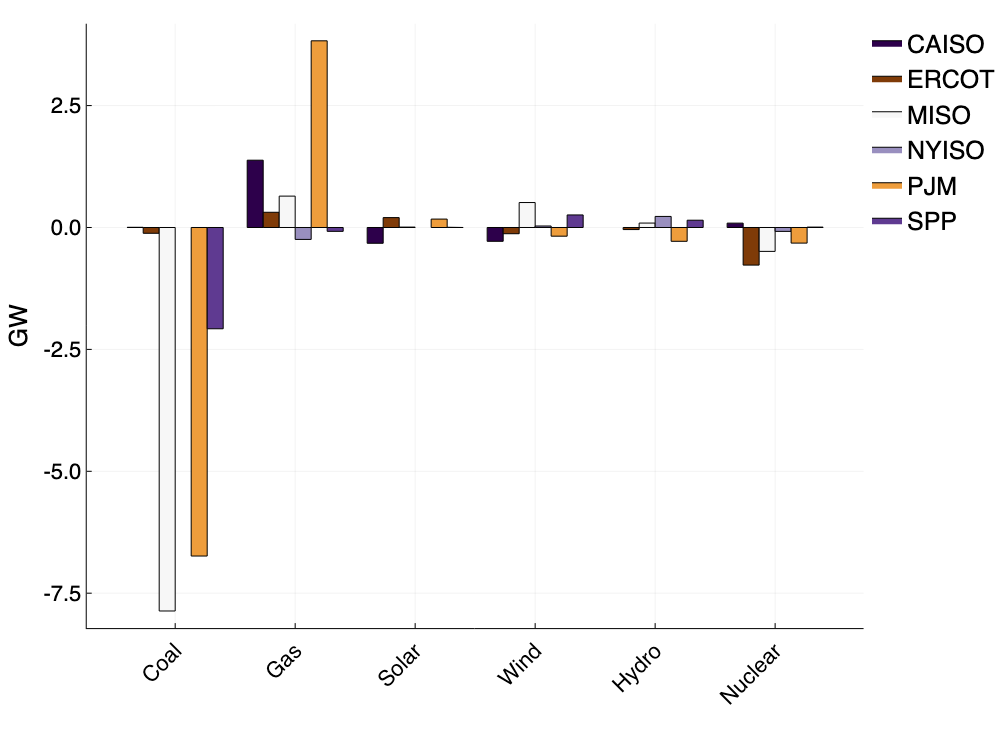 Figure 5: Average hourly change in production by fuel type between April 2020 and April 2019.
Looking at real time market wide energy prices, for most ISOs we can see that leading up to the outbreak of Covid-19, electricity prices were already down compared to 2019 levels (Figure 6). Coming into April, most ISOs had lower prices than at any time this year, and whilst prices continue to be low for some of the ISOs, an upwards trend emerges throughout the lockdown period.
The marketwide energy price is dependent on the least-cost generators available, and there are several factors, such as changing weather conditions and fluctuations in fuel supply, which can affect the generators available to serve demand. As an example, natural gas is one of the cheapest fuels for electricity generation. However, fluctuations in crude oil prices can have large impacts on the cost of natural gas generation, because a form of gas fuel, known as associated gas, is a by-product of crude oil. With the recent crash in oil prices where we saw negative oil futures for the first time in history, the production of associated gas has likely decreased throughout April. In the US, where close to 40% of generation is based on natural gas sources, a reduced supply of natural gas may be causing rises in electricity prices.
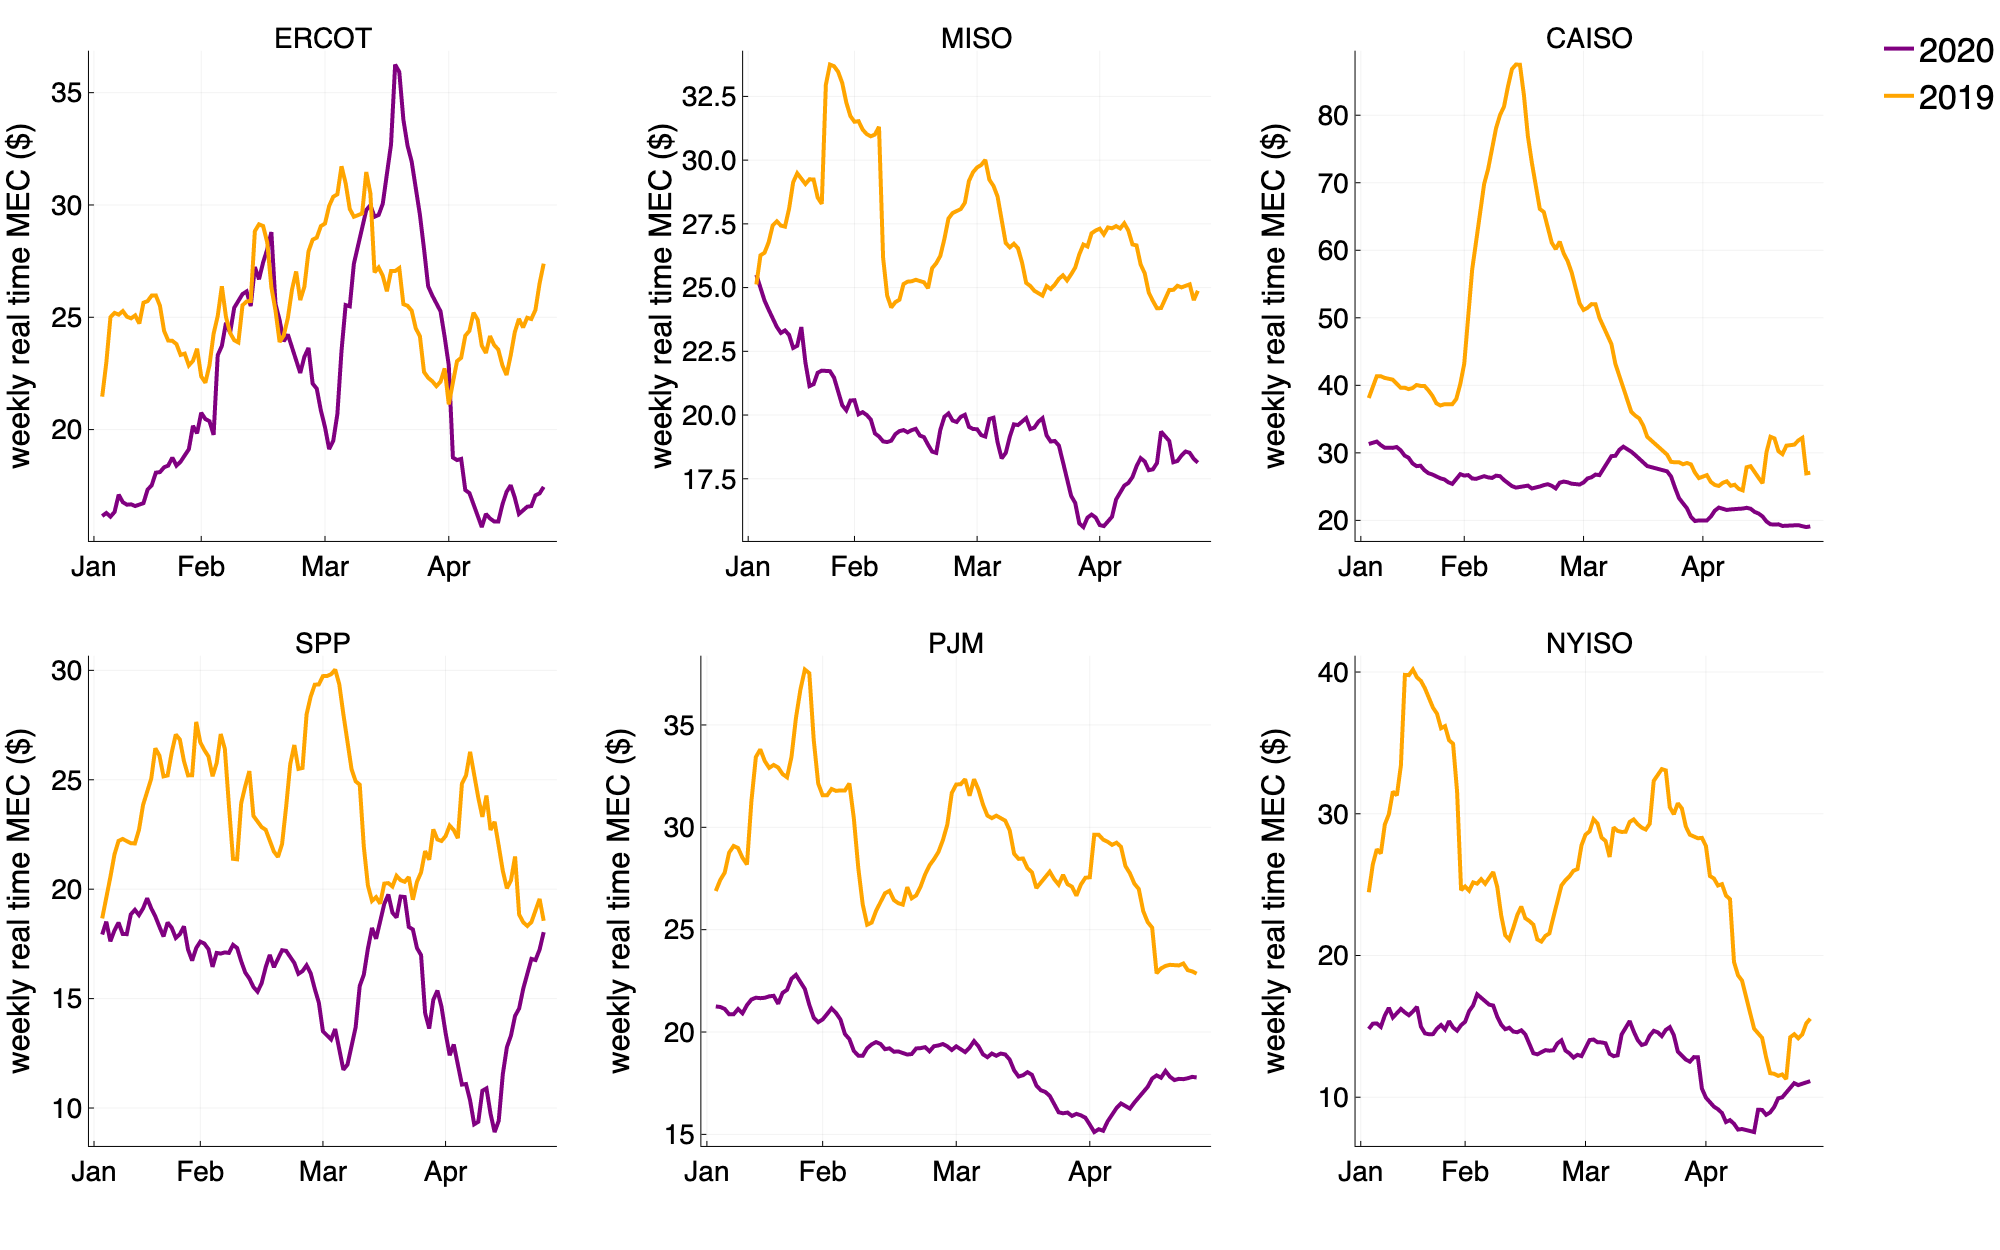 Figure 6: 7 day rolling average of the real time market-wide marginal energy cost for 2020 (purple) and 2019 (orange).
Conclusions
In this final post in our series, we have seen how electricity systems in the United States have responded to the changing patterns of electricity use induced by statewide lockdowns. We find demand forecasting has become more difficult for many of the ISOs, with CAISO forced to curtail record amounts of renewable power to manage oversupply and mitigate line overloading. Further, as was the case for Europe, we see coal generation taking the brunt of the decline in energy production, as lower cost generators are able to serve the depleted load. Finally, we explored how wholesale electricity prices have been affected by these changes. Whilst prices during lockdown have been the lowest seen this year, confounding factors such as the recent crash in oil prices may have led to rising wholesale electricity prices throughout April.
-
Our estimates only account for nine of the European countries most heavily affected by Covid-19. A later report performs a similar analysis for the whole of the EU27+UK, finding emissions reductions equivalent to that of roughly 5 million people. ↩
-
The linear temperature correction we apply is valid in mild temperatures when energy demand decreases as the demand for heating is reduced. When temperature exceeds ~20˚C, the relationship is more complex, and was not adjusted for in this analysis. ↩
-
Behind-the-meter generation is power production that is not controlled by the electricity system operator. In the case of solar power, this is often from residential solar panels. This shows up as demand reductions, as more people are providing power for themselves, using their onsite power generation systems. ↩
-
The largest coal plants in the US have ~3.5GW capacity, so the reductions we see correspond to two of the largest plants halting operations. The annual emissions of these plants is roughly 16Mt of CO₂, meaning that closure for one month would correspond to 1.3Mt of CO₂ emissions saved per coal plant. ↩